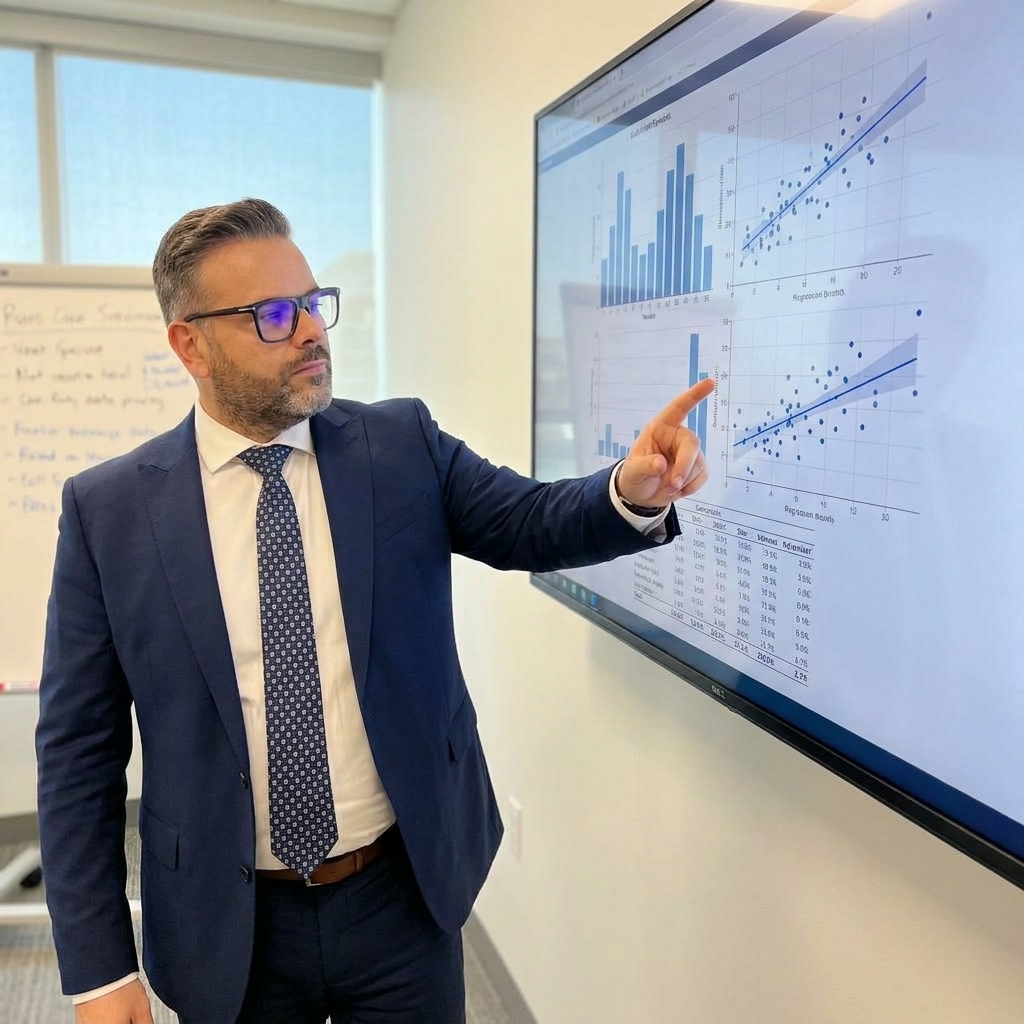
In a Tier 1 automotive plant, a quality manager once proudly announced that defects on a critical line dropped by 40% in a single month. Management commended the shift supervisor, awarded a bonus, and published his photo in the company newsletter. The following month, the defect rate returned to its previous baseline. Management was furious, assuming the supervisor had stopped trying. He had not. The organization had simply experienced regression to the mean.
This statistical force is one of the most misunderstood concepts in quality management. Extreme observations—exceptionally good or exceptionally bad results—are naturally followed by more average ones. When management attributes this natural regression to human effort, they build an incentive system that rewards luck, punishes randomness, and demotivates the workforce. They mistake statistical noise for meaningful signals.
I have audited plants where this exact dynamic drives the entire quality culture. Organizations launch corrective actions against random fluctuations, creating a graveyard of ineffective countermeasures. To build a reliable quality system, you must understand statistical variation. Without this foundation, every management review becomes an elaborate ritual of misinterpreting noise.
The Mechanics of Statistical Regression
Extreme events are, by definition, unlikely. The most probable event following an extreme result is an average one. If you flip a coin ten times and get nine heads, the next ten flips will likely look more like five heads and five tails. The coin did not learn, try harder, or respond to an incentive program. Nine heads was always unusual, and unusual results do not repeat simply because you gave them a bonus.
In manufacturing, this dynamic plays out continuously. Your defect rate hits an all-time low, then rises the next month. A supplier delivers perfectly for three shipments, then sends a batch with nonconformities. Your worst-performing operator suddenly has an error-free week, followed by an ordinary one. None of these fluctuations require an explanation rooted in human behaviour. They require an understanding of variation.
W. Edwards Deming spent decades demonstrating that most performance variation belongs to the system, not the individual. When you praise someone for an exceptionally good month or punish them for an exceptionally bad one, you are likely reacting to common cause variation. By misattributing system noise to individual performance, you stop looking at the process. The system is where the actual leverage for improvement lives.

Building the Wrong Scorecard
When organizations treat every fluctuation as meaningful, their KPI dashboards become misleading. A process metric that drops from 120 PPM to 80 PPM did not necessarily improve; it may have simply had a statistically average month. However, management often adopts that 80 PPM figure as the new baseline, standard, and target. When the metric predictably rises back to 110 PPM, someone must explain why quality is declining.
The explanation is simple: the process was never sustainably at 80 PPM. That was a single data point, not a trend. But organizations build expectations, budgets, and headcount plans around that isolated number. Reality then appears to underperform. This dynamic forces engineers and supervisors to manipulate reports to protect themselves from being blamed for statistical inevitabilities.
Rewarding and punishing people based on random variation is deeply corrosive. Every bonus given for an exceptionally good quarter likely rewards statistical noise. Every performance improvement plan issued for a bad quarter punishes randomness. Smart employees learn to game this system. They wait out their bad months, knowing regression will rescue them, and they aggressively lock in rewards for good months before the numbers revert.
Implementing Fixes for Non-Existent Problems
When a defect rate spikes from 200 PPM to 450 PPM, the standard management response is to launch a formal corrective action. A cross-functional team forms, root cause analysis begins, and countermeasures are deployed. When the defect rate subsequently drops to 220 PPM, the team celebrates a successful intervention. But in many cases, the process simply regressed to its mean.
If you cannot distinguish between a genuine process shift and statistical regression, you do not know which of your improvements actually worked. You accumulate a history of theatrical responses to random variation. Every non-problem you solve adds a layer of process complexity, an approval step, or a new checkpoint. None of this bureaucracy improves the product. It merely consumes engineering hours.
Reacting to every data blip as if it were a signal creates alert fatigue. Teams learn that any variation triggers a management response, so they begin smoothing the data, delaying reports, or reclassifying defects to keep the numbers looking stable. In trying to respond to every signal, the organization becomes blind to the real ones, masking actual process failures until they escalate into customer escapes.
Systemic Variation vs. Statistical Noise
Reacting to Noise
- Launching an 8D for a random PPM spike
- Rewarding an operator for a statistically likely low-defect month
- Adding inspection steps after an inevitable regression
- Setting new baselines based on extreme data points
Evaluating the System
- Using control charts to establish process limits
- Investigating only special cause variation
- Focusing improvement on systemic process capability
- Judging performance based on sustained data trends
The Control Chart as a Defence Mechanism
Walter Shewhart designed the control chart specifically to separate real signals from the noise of natural variation. A control chart does not merely tell you that a defect rate increased. It establishes upper and lower control limits that define the voice of the process. It tells you whether an increase is statistically meaningful or falls within the expected range of random common cause variation.
Anything inside the control limits is system noise. Anything outside those limits is a signal requiring investigation. This is not a minor academic distinction. It is the difference between managing actual manufacturing reality and reacting to shadows. When an organization implements control charts properly, it stops launching corrective actions for random variation and stops punishing people for being unlucky.
Control charts provide a shared language for discussing variation. Discussions no longer depend on opinions, gut feelings, or who speaks loudest in the management review. If a data point does not breach a control limit, it does not warrant a systemic root cause investigation. This discipline preserves engineering resources for genuine special cause events.
By misattributing system variation to individual performance, you stop looking at the system, which is where the leverage lives.
Separating Common Cause From Special Cause
Deming’s framework for variation remains the gold standard for process management. Common cause variation is the natural rhythm built into the system. You cannot eliminate it by reacting to individual data points or threatening operators. You eliminate it by fundamentally changing the system: installing new equipment, redesigning the process flow, altering materials, or retraining the workforce.
Special cause variation is something entirely new in the system. This includes a machine malfunction, a contaminated batch of raw material, or an untrained operator moved to a critical station. This type of variation requires immediate investigation and a specific, targeted response. It is a true signal that the process has shifted.
Regression to the mean is fundamentally a common cause phenomenon. Reacting to it as if it were special cause is the most common and expensive mistake in quality management. At WITTE Automotive, I observed how implementing Routing Verification KPIs clarified these boundaries. By focusing on the systemic flow rather than isolated defects, we eliminated 97% of internal lead time delays caused by reacting to false alarms.
Data-Driven Corrective Action Protocol
- 01Establish Process BaselinesCalculate upper and lower control limits using historical data.
- 02Monitor Real-Time DataPlot ongoing production metrics on control charts, not just monthly summaries.
- 03Identify Special CauseTrigger an 8D or formal investigation only when limits are breached.
- 04Address Common CauseTreat in-limit variation as a system engineering challenge, not a disciplinary issue.
Designing Incentives That Do Not Fight Statistics
Performance incentives must be designed around sustained improvement, not single-period results. A bonus for reducing defects by 20% over six consecutive months carries statistical weight. A bonus for having one exceptionally good month rewards luck. Single data points are meaningless for evaluating capability or performance. Trends, direction, and consistency of movement over time are what matter.
Organizations should design incentives around behaviours and system improvements rather than isolated outcomes. Reward the engineering team that implements a poka-yoke device or successfully completes a PFMEA update. Reward the supervisor who maintains accurate OEE records and executes standardised work. You control the process inputs. The outputs will reflect those inputs, regardless of short-term statistical noise.
Every manager, supervisor, and team leader must understand the basics of variation at a practical level. They need to know how to avoid fooling themselves. Deming refused to consult with organizations whose leadership had not studied these principles. He understood that without this foundation, every IATF 16949 or ISO 9001 initiative is built on sand.
In the Slovak automotive plant mentioned earlier, management eventually plotted two years of defect data on control charts. They discovered their process had been essentially stable the entire time. All the bonuses, reprimands, and corrective actions were reactions to noise. However, two genuine special cause signals, a tooling shift and a material substitution, had been completely buried in the false alarms.
The plant established a simple rule: no formal corrective action without control chart evidence. Within a year, the volume of corrective actions dropped significantly. The ones that remained addressed actual systemic failures. The customer complaint rate fell to its lowest level in years. Excellence in quality is not a single data point. It is a stable, predictable trend.