Defect rates spike during the second quarter. The plant manager mandates an all-hands meeting, forms root cause analysis teams, and deploys corrective actions. The line adds new inspection checkpoints. Defect rates predictably drop in the third quarter. Management declares victory, the corrective actions are institutionalised, and the new inspection points become permanent.
Except none of it was real. The spike was random variation, and the subsequent drop was just the process normalising. By punishing operators for bad luck and rewarding them for good luck, the organisation embedded unnecessary process changes that added cost without adding value. This statistical illusion is regression to the mean, and it drives massive financial waste across the manufacturing sector.
I have audited plants where highly capable processes were destroyed by this exact overreaction. When management treats every data point as a crisis, engineers cannot perform actual root cause analysis. The fundamental goal of quality management is to distinguish between genuine process shifts and inherent statistical noise, ensuring that interventions deliver measurable value.
The Anatomy of a False Correction
Consider a CNC machining cell producing parts with a dimensional tolerance of ±0.05mm. The historical capability index sits at a solid Cpk 1.33. Suddenly, in a single week, three parts out of 200 are measured out of specification. This failure rate triggers alarm, entirely bypassing the statistical reality that capable processes will still occasionally produce random defects.
The quality engineer flags the deviation and launches a Corrective and Preventive Action (CAPA). The team gathers to examine tooling, checks raw material certifications, reviews operator training records, and inspects maintenance logs. Everything is in order. The operator confirms nothing changed in the routine. The CAPA form demands a root cause, forcing the team to manufacture one.
The investigation concludes that advanced tool wear caused the failures. The corrective action involves shortening the tool change interval and increasing inspection frequency from every 20th part to every 10th part. Over the next three weeks, no out-of-spec parts appear. The CAPA is closed, and the corrective action is declared effective.
The devastating reality is that the original defects and the subsequent perfect weeks were both random variation. The process was already stable and capable. Nothing was actually wrong, and nothing was actually fixed. The plant permanently absorbed the ongoing costs of unnecessary tool changes and redundant inspections, artificially inflating the cost per unit indefinitely.

Why Manufacturing Is Structurally Vulnerable
Modern manufacturing plants generate massive volumes of measurement data. When you inspect thousands of parts daily across dozens of dimensional parameters, you will find extreme values purely by statistical chance. The relentless collection of big data means you will always find anomalies if you look hard enough, driving organisations to hunt for false corrections.
The industry's strong accountability culture demands that someone must answer for every deviation. This structural pressure forces engineers to find root causes even when none exist. The CAPA process, while mandated by IATF 16949 and AS9100, structurally assumes every single deviation has an identifiable and correctable cause, completely ignoring the mathematical reality of common cause variation.
Visual management systems and escalation protocols intensify this vulnerability. Red lights on production dashboards generate urgency around every minor blip. In high-stakes sectors like automotive and aerospace, the severe financial consequences of escaped defects create a rational risk aversion. Plants treat every data point as a crisis because they cannot afford to miss a genuine signal, generating massive operational heat without statistical light.
The Financial Anatomy of an Unnecessary CAPA
Institutionalised Statistical Errors
Supplier scorecards routinely punish random bad luck. A supplier delivering 50,000 parts monthly at a historical 0.1% defect rate eventually delivers a batch at 0.3%. Their scorecard drops, they are placed on watch status, and they submit a formal 8D corrective action plan. The subsequent batches fall back to 0.08%, and the corrective action is praised internally as a success.
The original elevated defect rate was statistical noise. The subsequent 0.08% batch was simply the data regressing to the mean from an unusually high month. The supplier wasted engineering resources documenting a non-existent problem, and the customer wasted resources reviewing it. The partnership is strained over routine mathematical variation.
Operator performance rankings suffer the exact same illusion. When a skilled operator experiences a randomly bad week, they are retrained or counselled. Their performance predictably improves the following week, and management credits the intervention. Meanwhile, an operator enjoying a randomly perfect week is praised, and their inevitable regression to average performance triggers an unnecessary investigation.
Applying Deming and Statistical Process Control
W. Edwards Deming strictly distinguished between special cause variation, where something genuinely changed in the process, and common cause variation, the natural variability inherent in any stable system. Reacting to common cause variation as if it were a special cause is what Deming called tampering. Tampering mathematically increases total variation and destabilises a capable process.
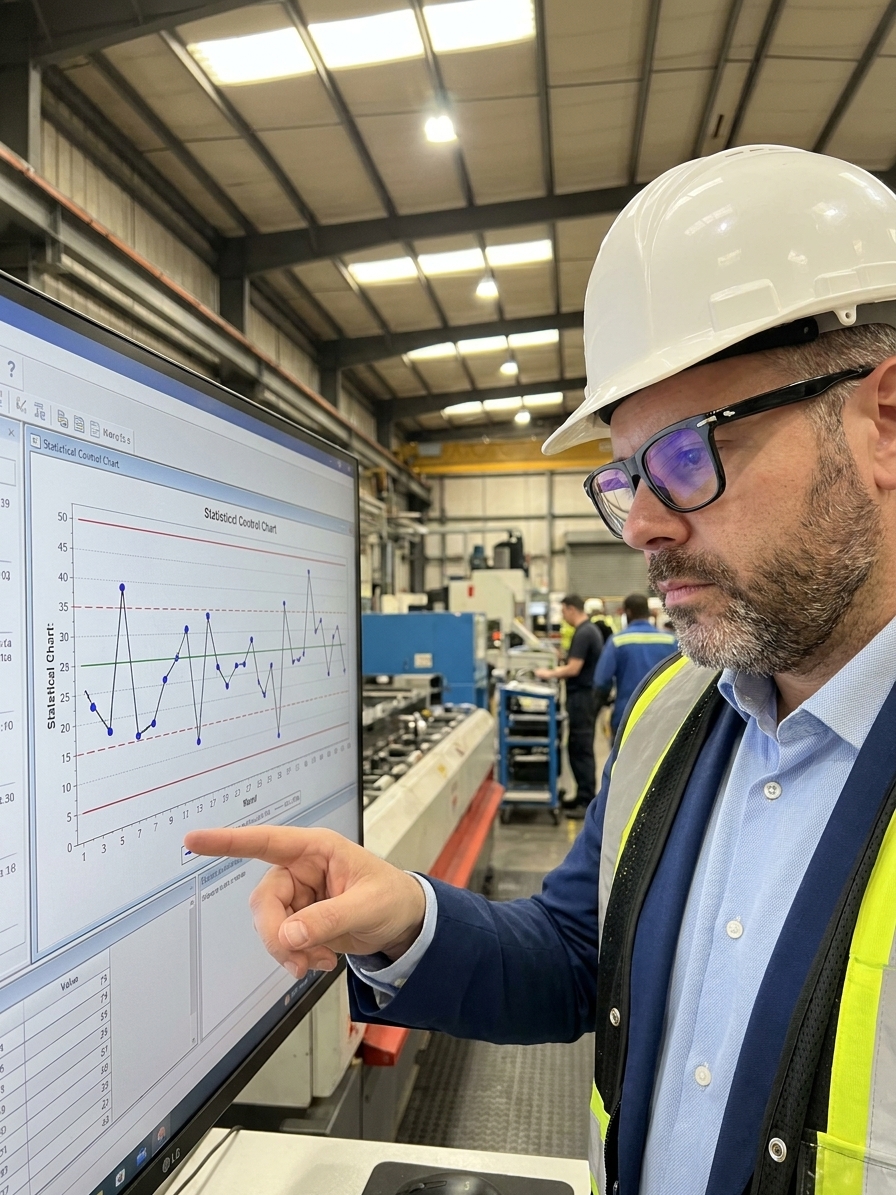
Statistical Process Control (SPC) is the primary defence against tampering, but only when applied correctly. A point outside a control limit is a flag warranting investigation, not an automatic mandate for immediate process changes. Too many plants use SPC charts strictly as escalation triggers rather than diagnostic tools. The correct response to a borderline data point is to investigate, not to panic.
The Western Electric rules and Nelson rules were specifically developed to distinguish meaningful statistical patterns from random noise. A single bad batch tells you nothing about process stability. Three consecutive bad batches, or seven consecutive batches trending in one direction, provide the statistical evidence required to justify a systemic intervention and the implementation of a new control plan.
If a data point falls inside the control limits, the process is behaving as it always has. No action is needed beyond continued monitoring.
Correct Signal Response Workflow
- 01Identify DeviationAn out-of-spec part or spike in the defect rate is recorded by the measurement system.
- 02Consult SPC ChartDetermine if the data point represents a special cause or falls within expected common cause variation.
- 03Monitor if Common CauseIf the process is in statistical control, take no action other than continued routine monitoring.
- 04Investigate if Special CauseOnly trigger an 8D or CAPA if Nelson or Western Electric rules demonstrate a genuine statistical shift.
The Mathematics of Mistaken Corrections
A mid-size automotive supplier typically runs approximately 500 CAPAs per year. If conservative estimates hold true, 30% to 50% of these investigations are triggered entirely by random variation rather than genuine process changes. Each unnecessary CAPA consumes engineering hours, halts production for data gathering, and bakes permanent inefficiencies into the standard work instructions.
Assuming a fully loaded engineering cost and standard production downtime rates, each unnecessary investigation costs thousands of dollars in direct expenses alone. When you multiply this across 150 to 250 false CAPAs annually, a single plant easily burns over a million dollars in wasted effort. Across the global automotive supply chain, the cost of regression-to-the-mean overreaction is staggering.
The hidden opportunity cost is even more severe. Every hour an engineer spends documenting a false root cause for random noise is an hour not spent improving an unstable process or reducing actual scrap. Management fails to realise that the pursuit of zero defects through blanket CAPA generation actively degrades the overall quality system by redirecting critical problem-solving resources.
Building a Regression-Aware Culture
The hardest part of fighting regression to the mean is organisational, not statistical. It requires asking managers to tell their superiors that a recent defect spike does not require a visible response. It requires asking quality engineers to close formal investigations with the conclusion that no root cause exists and no corrective action is required.
Leadership must stop demanding absolute root causes for every minor deviation. Accepting that some variation is inherent is the first step toward statistical maturity. Organisations must explicitly create space within the quality management system for common cause variation to be documented and accepted, removing the artificial pressure to assign blame for random events.
Production supervisors must be trained to consult control charts before escalating any deviation. If the process remains in statistical control, the line supervisor must hold firm and monitor the situation rather than issuing alerts. The best quality organisations in the world do not react faster to variation; they react with precision, saving their resources for the battles that actually matter.