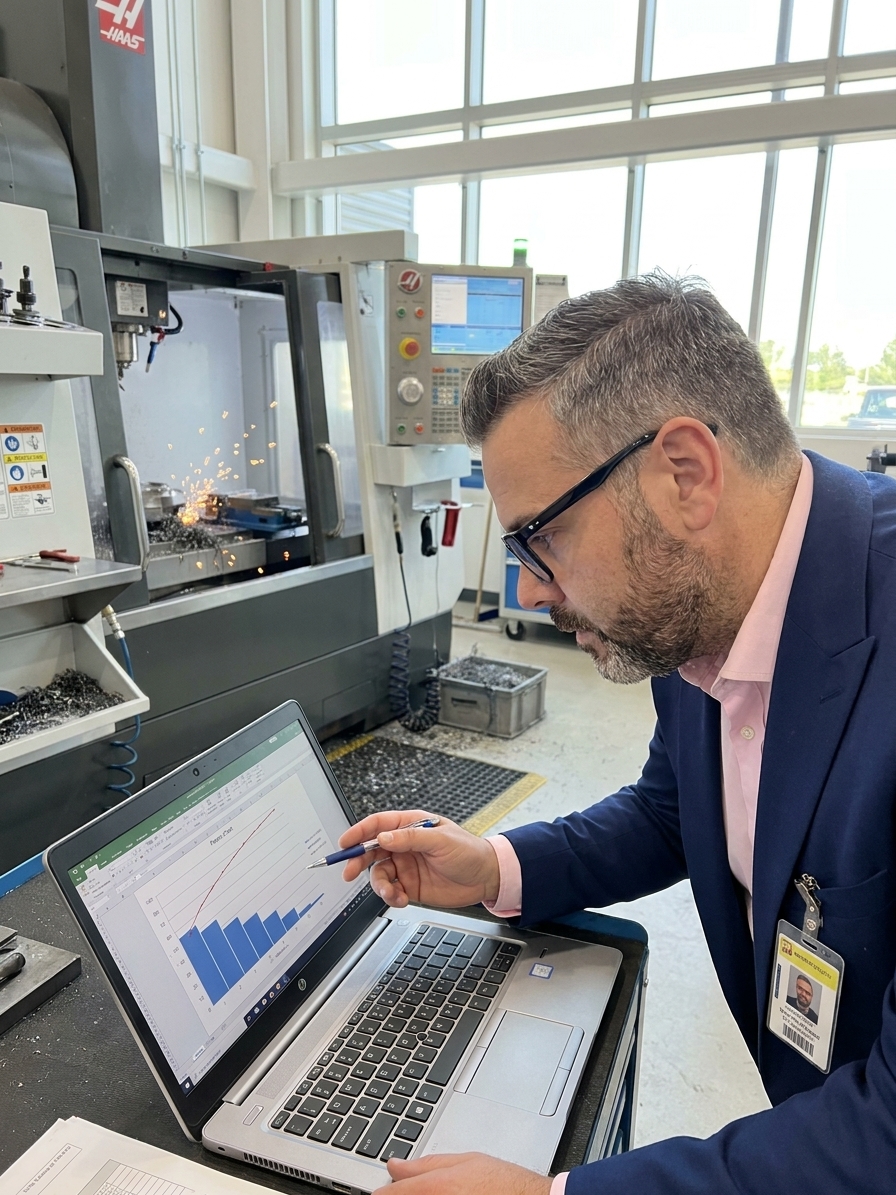
Joseph Juran did not invent the observation that a few causes produce most effects, but he was the first to apply it rigorously to manufacturing quality. Working with defect data at Western Electric's Hawthorne Works in the 1940s, he saw that a small number of root causes — worn tooling, inconsistent raw material, a single misaligned fixture — accounted for the majority of scrap, rework, and customer returns. He named the pattern after Vilfredo Pareto, the Italian economist who had observed a similar asymmetry in land ownership.
Juran framed the insight in a way that quality practitioners still struggle to follow: stop trying to fix everything at once. Find the vital few causes. Deliberately neglect the trivial many. The principle applies universally in manufacturing — 80% of scrap typically originates from 20% of process steps, 80% of warranty claims from 20% of suppliers, 80% of downtime from 20% of machines. The exact ratio varies, but the asymmetry does not.
The Pareto Principle is the most powerful prioritization tool in quality management. Yet most organisations apply it once, laminate the chart, and go back to chasing every defect with equal effort. The discipline lies not in drawing the chart but in acting on what it tells you — and in having the managerial courage to let low-impact problems wait.
What the Pareto Distribution Actually Looks Like
I have audited plants tracking 40 or 50 distinct defect categories in their SPC systems, presenting all of them with equal weight in weekly quality reviews. In one automotive components plant running 14 CNC machining centres, the quality team tracked 47 defect categories. Every Monday, the production leadership spent two hours arguing across the full list — row 3 and row 31 and row 44 debated with equal conviction and equal futility. No priority emerged.
When the team sorted the same data by total cost of poor quality — scrap value plus rework labour plus warranty exposure — the picture changed immediately. Four defect categories out of 47 accounted for 81% of total quality cost. The top eight accounted for 94%. The remaining 39 categories, combined, represented 6%.
The team chartered four focused improvement projects, each with a dedicated owner, a defined root cause, and a specific target. Within eight weeks, two of the four defect modes were eliminated permanently. Within six months, overall defect rates had dropped by 60%. The Monday meetings got shorter because there were fewer problems worth discussing.

Why Organisations Resist Deliberate Focus
The biggest barrier to Pareto-driven improvement is not analytical — it is organisational. Every defect feels urgent to the person who found it. Every customer complaint demands a response. Every audit finding generates a corrective action request. Stakeholders advocate for their own pain points, and leadership, reluctant to alienate anyone, attempts to address them all simultaneously.
The result is a quality programme that resembles a buffet: a little effort on many problems, no depth on any of them. Resources dilute across dozens of low-impact initiatives. Six months later, the dashboard shows activity — action items completed, corrective actions closed — but the actual defect rate has barely moved. The vital few causes remain untouched because nobody sustained focus long enough to solve them.
A related failure mode is the tyranny of the easy fix. Organisations gravitate toward problems that are simple to solve — adjust a fixture, update a work instruction, add a visual aid. These generate quick wins and visible progress. But the dominant quality cost driver is often deeply embedded: a tooling design flaw, a raw material specification gap, a fundamental process capability shortfall below Cpk 1.33. These require real engineering work and capital investment. The Pareto Principle demands you tackle causes in order of impact, not in order of difficulty.
Scattered vs Concentrated Quality Effort
What teams default to
- Treat all 47 defect categories as equally urgent
- Solve the 10 easiest problems first for quick wins
- Each department works its own isolated Pareto chart
- Measure success by corrective actions closed
What actually works
- Rank by cost of poor quality, attack the top 4
- Pull the hardest lever if it drives 40% of defects
- Work the value-stream Pareto that crosses departments
- Measure success by defect cost eliminated
The Political Dimension of the Vital Few
Major defect causes almost always cross departmental boundaries. The biggest quality problem in a plant might originate from a raw material specification owned by Engineering, sourced through Procurement, verified by Quality on incoming inspection, and processed on Manufacturing's equipment. No single department wants to own the solution because solving it requires cross-functional collaboration, capital expenditure, and political capital.
Instead, each department works on the problems entirely within its own span of control. Quality improves inspection procedures. Manufacturing runs operator training. Engineering adjusts design tolerances. Each department demonstrates progress on its internal scorecard — but nobody is working on the Pareto chart that matters, which is the one for the entire value stream.
This is why effective Pareto analysis requires leadership-level sponsorship, not just quality-team ownership. The quality manager can draw the chart and identify the vital few. But when the top defect cause requires a capital request that crosses Engineering, Procurement, and Manufacturing budgets, only a plant manager or operations director can remove the barriers. Without that authority behind it, the Pareto chart becomes an interesting display rather than a driver of change.
The Pareto Principle demands something uncomfortable: deliberate neglect. You must look at 39 defect categories and decide to ignore them for now.
A Field-Tested Pareto Method
The first decision is what unit of measurement to rank by. Defect count is the easiest to collect but the most misleading — a cosmetic scratch occurring 1,000 times per month is less significant than a dimensional nonconformance occurring 50 times but generating substantial warranty exposure per incident. Cost of poor quality is the most actionable measure because it connects quality improvement directly to business outcomes.
Collect data over a representative window — 30 to 90 days is typical, long enough to capture normal process variation but short enough to remain current. Rank defect categories from highest to lowest impact. Calculate the cumulative percentage. The point where the cumulative line crosses 80% marks the boundary between the vital few and the trivial many. A spreadsheet is sufficient; the power is in the ranking, not the visualisation software.
The Pareto Improvement Cycle
- 01Measure by cost impactRank defect categories by total cost of poor quality over 30-90 days
- 02Identify the vital fewDraw the cumulative curve — causes above 80% are the targets
- 03Validate with root cause analysisRun 5 Whys or fishbone on each vital few defect to find the mechanism
- 04Charter focused projectsAssign dedicated teams with clear targets, deadlines, and cross-functional authority
- 05Re-analyse quarterlySolved causes drop off; new ones emerge — the distribution shifts
Stratification: Finding the Hidden Pattern
A single Pareto chart identifies the dominant defect types. A stratified Pareto analysis reveals where those defects concentrate — and that concentration is usually where the root cause lives. Stratification means breaking the top defect categories into layers: by shift, by machine, by supplier, by product variant. Each layer sharpens the investigation.
Stratify by shift: if the top defect looks different on day shift versus night shift, the root cause is likely procedural — different operators following different methods, or different supervision standards. Stratify by machine: if Machine A produces a different defect profile from Machine B, you have a machine-specific issue, not a process-wide one. Stratify by supplier: if defects cluster around material from one source, the Pareto chart across suppliers reveals a disproportionate contribution that is invisible in aggregate data.
Each layer of stratification narrows the search. Instead of investigating a generic burr problem across the entire plant, you arrive at a burr problem on Machine C when running Part Number 4281 using material from Supplier B on night shift. That level of specificity makes root cause analysis faster, cheaper, and more accurate — and it makes the corrective action verifiable.
| Stratify by | Question it answers | Likely root cause domain |
|---|---|---|
| Shift | Do defects differ between day and night? | Procedural variation, supervision gaps |
| Machine | Is one machine an outlier? | Maintenance, tooling wear, calibration |
| Supplier | Does one material source cluster defects? | Incoming material nonconformance |
| Product variant | Are certain parts more defect-prone? | Design for manufacturability gaps |
Preventive Pareto: PFMEA, Inspection, and Supplier Risk
Most organisations apply the Pareto Principle reactively — analysing defects that have already occurred and cost money. The same principle is equally powerful in prevention, applied before defects happen. In your process FMEA, the Risk Priority Number — severity multiplied by occurrence multiplied by detection — creates a natural Pareto distribution. A small number of failure modes carry the majority of your process risk. Focus your preventive controls on those.
Inspection resources follow the same logic. Not all characteristics merit equal inspection effort. Critical characteristics — those affecting safety or regulatory compliance — require 100% inspection or robust error-proofing (poka-yoke). Major characteristics warrant statistical process control with defined control limits. Minor characteristics need only periodic verification. You do not have infinite inspectors; the Pareto Principle tells you where to deploy the ones you have.
Supplier quality management works the same way. Stratify your supplier base by historical quality performance, product complexity, and process maturity. Apply your most intensive controls — full PPAP requirements, incoming inspection, source verification, annual VDA 6.3 audits — to the small number of suppliers representing the greatest risk to finished product quality. Low-risk suppliers get periodic monitoring. The asymmetry in supplier risk is real, and your supplier control plan should reflect it.
There are legitimate exceptions to strict Pareto prioritisation. A defect that could cause injury or death must be addressed regardless of its frequency or cost rank. Regulatory requirements — FDA, EASA, IATF 16949 — mandate prevention of certain failure modes at any occurrence rate. And in processes where multiple minor defects compound synergistically into major failures, the trivial many may not be trivial. These exceptions are specific and identifiable; they do not invalidate the principle.
The Discipline to Let Problems Wait
Organisations do not fail for lack of effort in quality improvement. They fail for lack of focus. They treat all problems as equally urgent, all defects as equally important, all corrective actions as equally worthy of resources. The result is visible activity with invisible results — dashboards full of green checkmarks while the dominant cost driver sits untouched on the factory floor.
Your quality data is already telling you where to focus. The defect Pareto is sitting in your SPC system, waiting for someone to sort it by cost impact and draw the cumulative curve. The supplier Pareto is in your incoming inspection records. The machine Pareto is in your downtime logs. The customer complaint Pareto is in your 8D reports. The asymmetry is there in every dataset.
What is missing is not data, and it is not analytical method. What is missing is the organisational discipline to stop trying to boil the ocean — and the managerial courage to let 39 problems wait while the team solves the four that actually matter. That decision is uncomfortable, it is unpopular with stakeholders whose problems have been deprioritised, and it is the single highest-leverage choice a quality leader can make.