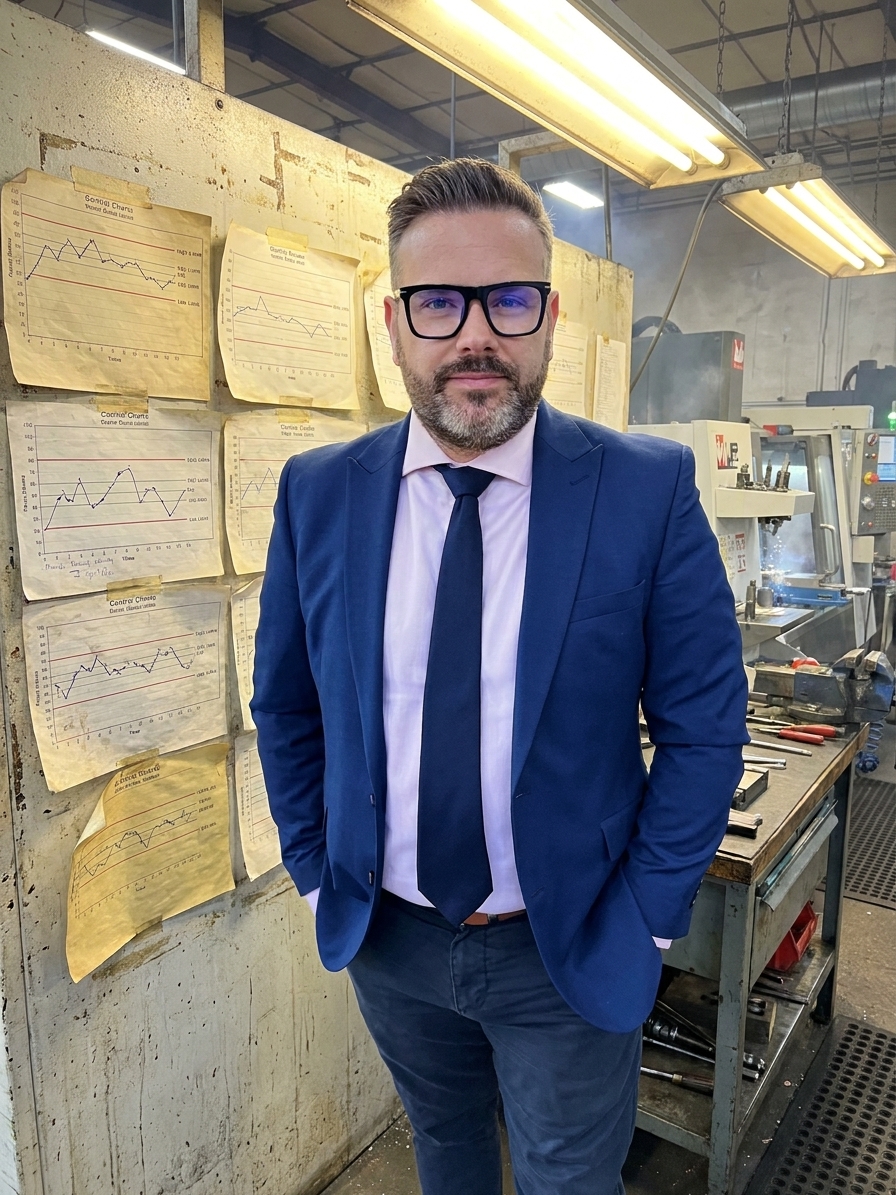
Walk into most manufacturing plants and you will find control charts taped to workstations, neatly formatted, and updated religiously. Operators fill them in because they were told to. The charts sit there for months without driving a single process change. The data exists, the signals are present, but nobody is home.
This is how Statistical Process Control, one of the most powerful quality tools devised, became misunderstood and quietly abandoned. The gap between what SPC can achieve and what most organisations use it for is massive. Form was preserved while substance was hollowed out.
The consequence is measurable. Organisations pay for this failure in scrap, rework, warranty claims, and expedited shipping. They pay in operator cynicism—the quiet conviction that quality is a paperwork exercise. I have audited plants where the charts were immaculate, but the processes they documented were producing scrap at unacceptable rates.
The Foundation: Common Cause Versus Special Cause Variation
Walter Shewhart, working at Bell Laboratories in the 1920s, made an observation that remains the foundation of modern quality engineering. Every process has variation, and that variation falls into two categories requiring entirely different responses.
Common cause variation is the natural, inherent variability in a process. The machine has slight play. Material varies within specification. The operator follows a standard routine. This variation is always present, predictable, and stable. Special cause variation means something outside the normal system has intruded. A tool fractured. A material lot is defective. The process is no longer behaving as designed.
Shewhart designed control charts to distinguish between these two types. The operational consequence is the point. If you see common cause variation, you leave the process alone. If you see special cause variation, you investigate immediately. Confusing the two makes the process worse.
W. Edwards Deming built on this foundation. He estimated that 94% of problems belong to the system; only 6% are attributable to special causes. That means 94% of the time, the fix is not to adjust the machine or blame the operator. The fix requires management to improve the system itself through equipment upgrades, material changes, or process redesign.
Stable Process Management vs Tampering
What teams do (Tampering)
- React to individual data points
- Blame operators for system variation
- Adjust speeds and settings continuously
- Increase overall process variation
What works (Stable response)
- Identify whether the signal is common or special cause
- Leave stable, in-control processes alone
- Investigate actual root causes for special variation
- Drive system-level improvements
The Three Failure Modes: Theatre, Overreaction, and Paralysis
The first failure mode is SPC as theatre. An auditor or customer demands implementation. The organisation buys software, identifies key characteristics, and trains operators to record measurements. The charts go up on the wall to satisfy a requirement, not to inform decisions. They become documentation rather than control mechanisms.
The second failure mode is overreaction, commonly called tampering. Engineers or operators see a single point outside the control limit and immediately start adjusting the process. They tweak speeds, change settings, and swap tooling in response to a random event. The process, which was stable, becomes unstable because of the interventions. Every adjustment to a stable process increases variation by approximately 50%.
The third failure mode is paralysis. The organisation has been burned by tampering and swings to the opposite extreme. Nobody adjusts anything. Points fall outside control limits and are ignored. Classic signals—seven points trending in one direction—develop without investigation. The control chart has become a historical record, not a real-time tool.
Tampering is the most common way organisations make their processes worse while believing they are improving them. The math is settled. Shewhart proved it. Deming demonstrated it. The Japanese manufacturing industry built its quality transformation on understanding it. Yet in factories worldwide, operators still twist dials in response to individual data points.

Conflating Control with Capability
A process can be in statistical control and still produce defective parts. This is not a contradiction. It means the process is stable and predictable, but its natural variation is wider than the specification limits. The process reliably produces out-of-spec parts. It is in control and incapable.
Conversely, a process can be producing parts within specification today but be out of statistical control. The variation is unpredictable. Tomorrow it might produce a batch of scrap. It is temporarily capable but fundamentally unstable. Confusing stability for adequacy leads to false confidence.
Capability indices—Cp, Cpk, Pp, Ppk—address this gap. Cpk tells you how many standard deviations fit between your process mean and the nearest specification limit. A Cpk of 1.33 means the process mean is four standard deviations from the nearest spec limit, yielding approximately 63 defects per million. In automotive, where IATF 16949 expectations demand fewer than 3.4 defects per million, you need a Cpk of 2.0 to meet world-class standards.
In practice, organisations calculate Cpk once during the initial process study. The number goes on the PPAP submission. The customer approves it. Then the process drifts—tooling wears, material lots vary, operators change—and nobody recalculates. The Cpk on file says 1.67. The actual Cpk today might be 1.1. The organisation is operating on a fiction locked in a binder.
| Process State | Statistical Control | Capability |
|---|---|---|
| Ideal | In control (stable) | Capable (Cpk > 1.33) |
| Consistently bad | In control (stable) | Incapable (Cpk < 1.00) |
| Lucky so far | Out of control (unstable) | Capable today, scrap tomorrow |
| Worst case | Out of control (unstable) | Incapable |
Digital Dashboards and the Illusion of Control
Many organisations have digitised their SPC systems. Operators enter data into tablets. Control charts appear on dashboards in real time. Alerts fire automatically when a point falls outside limits. Digital systems remove the tedium of manual charting and make data instantly available.
But digital systems introduce their own failure mode: the illusion of control. The dashboard looks impressive. The charts are colourful. Yet the alerts are muted because they fire too often—usually because the control limits were set incorrectly or the process is genuinely out of control and nobody wants to deal with it.
The data is collected at a granularity too coarse to catch real problems or so fine that noise overwhelms the signal. The dashboards display on a screen in the quality office that nobody monitors. Digital SPC does not fix a broken culture. It creates the appearance of sophistication that masks the brokenness from anyone who does not look closely.
A paper chart that an operator actually uses and an engineer actually reviews is worth more than a real-time digital dashboard that nobody acts upon. The medium is irrelevant. The discipline of response is everything.
What Functional SPC Looks Like
In a functioning system, operators understand variation at a practical level. They cannot calculate standard deviations, but they know the difference between a signal and noise. They know that a single point near the centreline means nothing and that seven points trending in one direction demands action. They have been trained in what the chart means, not just how to fill it out.
Engineers review charts daily or at least weekly, depending on production volume. They look for trends, shifts, and patterns operators might miss. They investigate special causes promptly—not two weeks later when the trail has gone cold. They document findings and corrective actions so institutional memory accumulates.
Control limits are dynamic. They are recalculated when the process has genuinely changed—new tooling, new material, new method—and left alone otherwise. The limits reflect the voice of the process, not the wishes of management. If management wants tighter limits, they must improve the process, not redraw the lines.
The system is periodically audited—not by an external auditor checking compliance boxes, but by the quality team checking for relevance. Are we measuring the right characteristics? Are the charts being used? Are signals driving action? SPC is not a fire-and-forget system. It requires maintenance, attention, and renewal.
Not the statistics, not the software, not the charts—the discipline of using data to drive decisions is what makes SPC work.
The Path Back to Data-Driven Control
If your SPC system has become wallpaper, the recovery starts with honesty. Pull every chart and ask one question: when was the last time this chart led to a specific action that improved the process? If the answer is never or during the initial implementation years ago, that chart is not serving its purpose. Fix it or remove it.
A small number of charts that people actually use is infinitely more valuable than a wall full of charts nobody reads. Identify the critical characteristics that actually drive product quality and customer satisfaction. Focus your measurement and response system there. Eliminate the charts that exist only to satisfy auditors.
Invest in understanding variation. Not training in software mechanics—training in what variation means, why it matters, and what to do when the chart signals. Operators who understand variation become partners in quality. Engineers who understand variation become problem-solvers. Managers who understand variation stop demanding individual root causes for systemic problems.
Finally, close the loop. Every signal must lead to a response. Every response must be documented. Every document must be reviewed. This is the discipline that separates organisations using SPC as a management tool from those using it as a compliance prop. Shewhart gave us the tool nearly a century ago. The math has not changed. The question is whether your organisation has the discipline to use it.