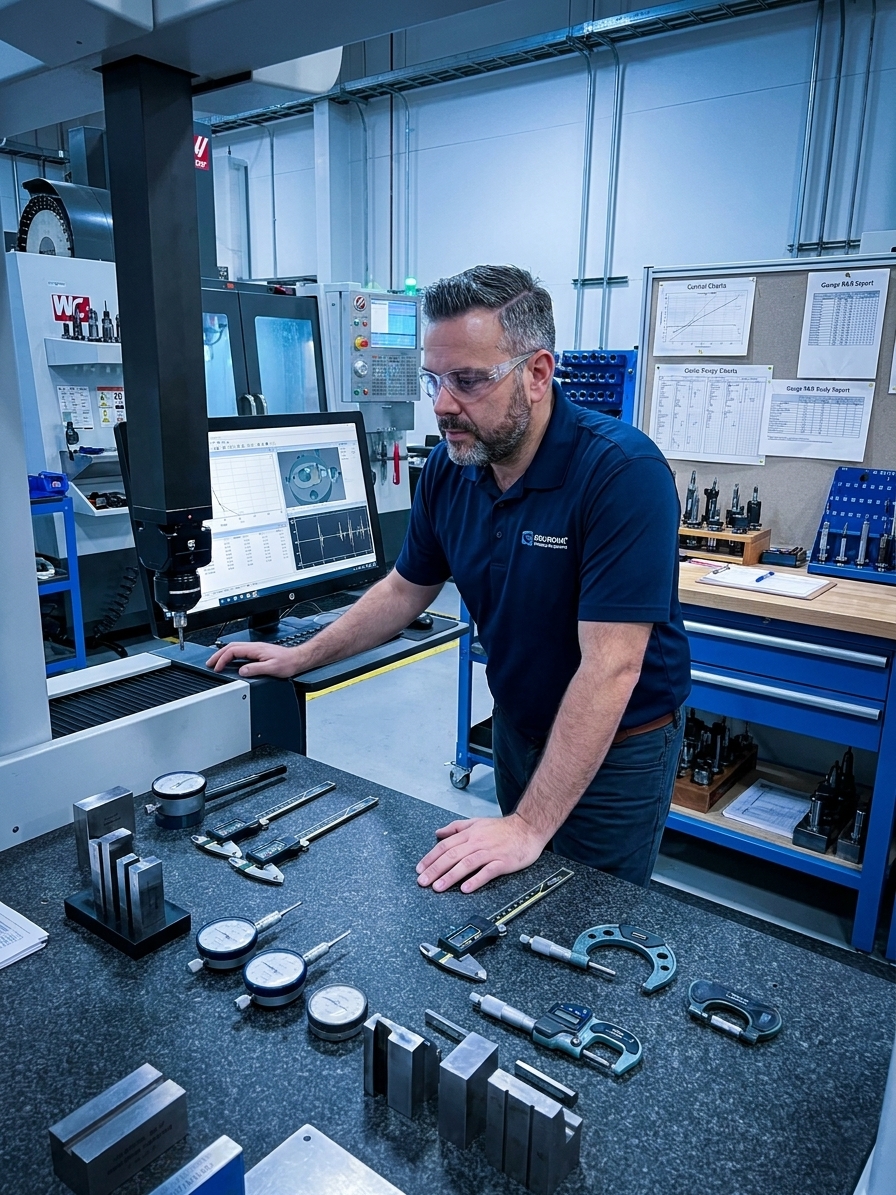
You cannot improve what you cannot measure. But the corollary is the one that destroys value: you cannot trust what you cannot measure accurately. Measurement System Analysis (MSA) answers a devastating question: how much of the variation you see in your data comes from your process, and how much comes from the gauge itself? If your measurement system is unreliable, every control chart, capability study, and accept/reject decision built on its data is compromised.
In plant after plant, MSA remains the most neglected corner of the quality management system. It is treated as a bureaucratic hurdle—a checkbox to tick before the PPAP submission goes out the door. The gauge R&R study is conducted once, at launch, with selected operators told to take their time. The acceptable number is filed, the PPAP is approved, and the study is forgotten. It only resurfaces when an audit finds a discrepancy or a customer rejects a shipment.
I have audited plants where the engineering team spent six weeks chasing a process shift that turned out to be a gauge drifting out of calibration. When organizations treat MSA as a compliance exercise instead of a foundation of trust, they make noise-driven decisions and call them data-driven. Moving from 'we did a gauge R&R' to 'we understand our measurement system' requires dismantling flawed practices and rebuilding how the organization interprets measurement data.
The Cost of Tampering with Noise
Consider a process engineer monitoring a critical CNC-machined dimension of 25.000 mm ± 0.050 mm. She pulls five samples an hour, measures them on a CMM, and plots the results on an X-bar/R chart. The chart shows the process drifting toward the upper specification limit. She initiates a tool offset, the next sample returns to target, and she moves on to the next fire. The system appears to work.
But what she does not know is that the CMM has a repeatability issue introducing ±0.015 mm of variation on every measurement. That measurement variation is indistinguishable from process variation on the control chart. When she sees the process shift toward the limit, she cannot know if the process actually shifted or if the gauge simply produced a high reading. By adjusting the process based on that reading, she is likely adjusting a process that was already on target.
This is tampering. Identified by W. Edwards Deming, it happens when you react to common-cause variation as if it were special-cause variation. It is almost always caused by a measurement system that lacks the resolution to distinguish between the two. The cost is enormous: increased variability, degraded process performance, and a quality record that looks responsive but is actually making things worse.

What MSA Actually Evaluates
A complete MSA evaluates five distinct characteristics. Bias is the difference between the observed average of measurements and a certified reference value. If a gauge consistently reads 0.003 mm high, that is systematic error shifting all readings in one direction. Linearity measures how that bias changes across the gauge's operating range. A single correction factor will not fix a gauge that is accurate at the low end but biased at the high end.
Stability assesses whether the measurement system's performance changes over time. Probes wear, fixtures loosen, and ambient temperature shifts. Stability requires measuring a standard repeatedly over time. It demands ongoing discipline, which is why it is the characteristic most commonly ignored in practice.
Repeatability is the variation seen when the same operator measures the same part multiple times on the same gauge. It is the equipment variation. Poor repeatability points to hardware: worn probes, loose fixtures, or sensors with insufficient resolution. Reproducibility is the variation seen when different operators measure the same part. It is the appraiser variation, pointing to procedural failures like ambiguous work instructions.
Repeatability and reproducibility together form what we call Gauge R&R. It is the number most people associate with MSA, and often the only number reported. But Gauge R&R without bias, linearity, and stability is a partial picture. Reporting a single R&R percentage while ignoring the other characteristics means you are validating a fraction of the measurement process.
| Characteristic | What it measures | Common failure mode |
|---|---|---|
| Bias | Difference between measurement average and true value | Un-calibrated reference or drift |
| Linearity | How bias changes across the measurement range | Assuming a single correction factor fixes all ranges |
| Stability | Performance consistency over time | Ignoring environmental wear and seasonal drift |
| Repeatability | Variation from the gauge itself (equipment) | Worn probes, loose fixtures, poor resolution |
| Reproducibility | Variation between operators (appraiser) | Ambiguous instructions, inconsistent technique |
Why AIAG Thresholds Mislead
The AIAG guidelines define three zones for Gauge R&R as a percentage of total study variation: under 10% is acceptable, 10% to 30% may be acceptable depending on risk, and over 30% is unacceptable. These thresholds are useful, but they cause enormous mischief when treated as pass/fail gates rather than diagnostic indicators.
The percentage is a ratio of measurement variation to total variation. If your process is highly capable with very little variation, the denominator shrinks. A well-controlled process with a decent gauge can produce a poor Gauge R&R percentage simply because the process variation is so low. This penalizes your best processes and creates a perverse incentive to keep process variation wide so the gauge looks acceptable.
The 10% threshold has also become a magical number. If a study returns 9.8%, people celebrate. At 10.3%, panic ensues. The real question is not whether the number is below 10%, but whether the gauge can distinguish between good and bad parts at the specification limits. That is a question of ndc—the number of distinct categories—and the gauge's resolution relative to the tolerance.
When a study comes back above 30%, the typical response is to redo it until the number improves. Teams use hand-picked parts that are closer together, freshly calibrated gauges, and the most careful operators. The number drops, the PPAP is approved, and the gauge on the production floor continues to produce data nobody should trust. The threshold was met, but the system was never understood.
Instead of asking 'did we do the gauge study?' the organization must ask 'do we trust this gauge to tell us the truth?'
Matching Study Types to Gauges
A proper MSA program uses a ladder of study types, each appropriate for a different stage of the measurement system's lifecycle. Choosing the wrong study wastes resources and generates misleading data. The study must match the gauge's architecture and the stage of its deployment.
The Type 1 Study is the simplest and most often skipped. It measures a single reference standard 30 or more times on a single gauge by one operator. It evaluates bias and repeatability in isolation. If a gauge fails here, there is no point proceeding to complex studies. It is cheap, fast, and brutally honest. It should be the first step when installing a new gauge.
The Type 2 Study is the standard Gauge R&R—typically an ANOVA method with 10 parts, 3 operators, and 3 trials. It evaluates both repeatability and reproducibility, highlighting operator-by-part interactions. The Type 2 study is the workhorse of MSA for manual gauges. When done correctly with the right parts and uncoached operators, it provides a comprehensive picture of the system's performance.
The Type 3 Study is a repeability study without operator influence, designed for automated gauges. It isolates equipment variation. For inline measurement systems, vision systems, and automated CMMs, the Type 3 study is the correct choice. Forcing a Type 2 study on an automated system by having operators simply load and unload parts wastes time and produces meaningless reproducibility errors.
The MSA Study Ladder
- 01Type 1 StudyIsolate bias and repeatability against a known standard on a new or repaired gauge.
- 02Type 3 Study (if automated)Validate equipment variation for inline, vision, or automated systems without human influence.
- 03Type 2 Study (if manual)Introduce operator variation to measure reproducibility via a standard 10-part, 3-operator ANOVA.
- 04Stability MonitoringConduct ongoing periodic checks using control charts to catch long-term drift.
The Silent Cost of False Rejects
When a measurement system has poor discrimination, two expensive things happen simultaneously. False accepts occur when an out-of-specification part is measured as good and passed through. The defective part reaches the customer, generating a complaint, an 8D, and a credibility hit. The cost of an escaped automotive defect can reach tens of thousands of dollars.
The investigation that follows a false accept will be conducted using the same unreliable measurement system that allowed the defect through. Without first fixing the gauge, the root cause analysis will generate incorrect conclusions, and the corrective action will fail to prevent recurrence. You cannot solve a process problem with a broken measurement system.
False rejects occur when a good part is measured as out-of-specification and scrapped. This is the silent cost. No customer complains, and no quality manager launches an investigation. The cost accumulates in the scrap account, disguised as 'normal process loss.' In precision machining, aerospace, and medical devices, false rejects driven by poor measurement systems quietly destroy margins.
You cannot quantify these losses without first quantifying the measurement system's performance. This requires the very studies that most organizations skip or manipulate. It is a closed loop of ignorance: we do not trust the measurement system enough to study it, so we cannot quantify how much it costs us, so we do not invest in fixing it. Breaking this loop requires a fundamental shift in how plants manage quality data.
Building a Risk-Based MSA Program
Building a real MSA program starts with a gauge inventory. List every gauge used for accept/reject decisions or process monitoring. For each, note the characteristic measured, the tolerance, the resolution, and the date of the last study. Most plants discover gauges that have not been evaluated since installation, or gauges whose resolution is a significant fraction of the tolerance.
Prioritize by risk. Not every gauge needs a full Type 2 ANOVA study every year. Focus first on gauges measuring safety-critical characteristics, gauges with tight tolerances relative to their resolution, and gauges showing signs of instability. This is a risk-based approach, identical to how you should manage calibration and every other aspect of your quality system.
When a study fails, act on the diagnostic data. If repeatability is the dominant failure, investigate the hardware: fixtures, probes, and clamping forces. If reproducibility dominates, investigate the procedure: work instructions and operator training. If operator-by-part interactions are present, the feature itself may be difficult to locate consistently, indicating a design-for-inspection problem.
Re-verify periodically based on that risk. Probes wear, fixtures loosen, operators change, and software gets updated. Build MSA re-verification into your calibration system. A gauge validated at launch may be entirely inadequate two years later. Do not wait for the next IATF 16949 or AS9100 audit to find out your measurement system is lying to you. Find out now, and earn the right to trust your data.