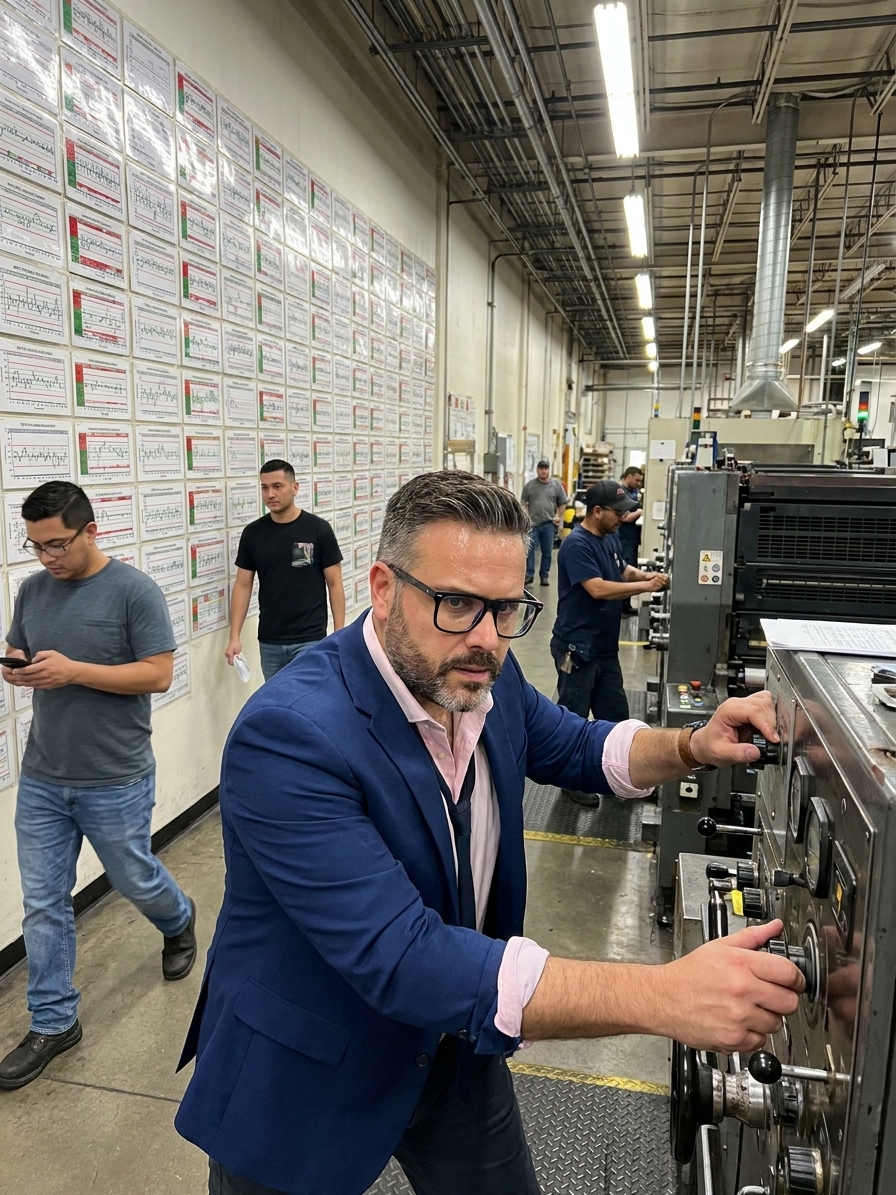
Every production floor has the same scene: a wall of laminated control charts, updated religiously by an operator whose job is to fill them in. Supervisors glance at them during audits. Quality engineers file them. Nobody actually reads them. Ask whether the facility practices Statistical Process Control (SPC) and the answer is always yes. The facility has charts, limits, and a procedure that mandates their use. What it does not have is control.
SPC is not about charts. It is about understanding variation. Every process produces output with two distinct kinds of variation, and responding to the wrong kind makes everything worse. Walter Shewhart, working at Bell Labs in the 1920s, made a distinction that should have revolutionised manufacturing. He divided variation into two categories: common cause and special cause. Confusing the two is the most expensive error a quality team can make.
I have audited plants that boasted robust IATF 16949 documentation but failed to identify a trending process during a live shift. The infrastructure was there. The understanding was absent. The entire point of SPC is to separate the noise from the signal, yet most shops treat all data points as emergencies, or worse, ignore them entirely.
The Distinction That Determines Quality
Common cause variation is the natural noise in your process. It is always present. It comes from the system itself: the machine's inherent precision, material lot-to-lot differences, ambient temperature swings. You cannot eliminate common cause variation by reacting to individual data points. You can only reduce it by fundamentally changing the system.
Special cause variation is a signal. It indicates something has changed: a broken tool, a material defect, a sudden shift in method. This you must investigate. The control chart exists to tell these two apart. The control limits, typically set at plus or minus three standard deviations from the process mean, represent the voice of the process. They tell you what the process normally does.
Control limits are not specification limits. They are not customer requirements. When a point falls outside these limits, the process is announcing a shift. The fatal error, the one W. Edwards Deming spent fifty years preaching against, is treating common cause variation as if it were special cause. Adjusting a process that was working fine is called tampering, and it amplifies the noise.

The Mechanics of Tampering
Consider a CNC operator machining a target diameter of 25.00 mm. The last part measured 25.06. The one before was 24.98. Now it reads 25.07. The operator sees a trend, decides the process is drifting high, and adjusts the offset down by 0.05 mm. The next part drops to 24.94. The operator adjusts back up. This continues back and forth, all shift long.
This is tampering. It is the single most common way that well-meaning operators destroy process capability. Every unnecessary adjustment adds variation to a process that was already stable. The operator is not improving quality; they are injecting instability. Deming demonstrated this with his funnel experiment. Every time you compensate for natural scatter by moving the funnel, the scatter actually increases.
The Tampering Cycle
- 01Natural VariationA part measures slightly above target, well within control limits.
- 02Operator ReactionThe operator perceives a false trend and manually adjusts the machine offset.
- 03OvercorrectionThe adjustment forces the next part to measure artificially low.
- 04Amplified InstabilityContinuous back-and-forth adjustment permanently increases process spread.
Selecting the Right Chart and Characteristic
A proper SPC program starts with selecting the right characteristic to monitor. Not everything needs a chart. Use your PFMEA to identify high-risk dimensions and key process parameters—things that affect fit, function, or safety. Vanity metrics, measurements taken because someone assumed more data is better, create noise and distract from critical signals.
Chart type matters. For variable data, X̄-R charts track subgroup averages and ranges, detecting shifts in the process mean and spread. For attribute data, p-charts monitor the proportion defective, while c-charts track defect counts per unit. The control limits for these charts are calculated entirely from the process data itself. A process with an engineering tolerance of ±0.5 mm might have control limits of ±0.08 mm.
The chart tells you the truth about capability regardless of customer expectations. Detecting special causes requires more than just looking for a point beyond three sigma. The Western Electric rules identify non-random patterns: eight consecutive points on one side of the centerline, or six points steadily increasing. These patterns indicate shifts, trends, or stratification problems before the process produces scrap.
What Actually Happens on the Factory Floor
In most facilities, SPC looks nothing like the textbook. Charts are decorations laminated for the customer audit. Data is collected because a procedure mandates it. Nobody looks at the charts during the shift. If a special cause appears on Tuesday, it might be noticed during the monthly quality review. By then, the tool is broken, the scrap is shipped, and the evidence is cold.
Operators are not trained. The person filling in the chart often cannot explain what the control limits mean or what to do when a point violates them. They received a twenty-minute briefing during onboarding covering where to write the numbers. The statistical reasoning was never explained. Furthermore, limits are rarely recalculated. The limits calculated during the initial PPAP capability study three years ago remain, frozen in time, while suppliers and tooling have changed.
A chart on a wall is not process control. Understanding variation, and acting on that understanding, is.
The most fundamental error is drawing specification limits instead of control limits. People draw the engineering tolerance on the chart and call it SPC. But specification limits are what the customer wants. Control limits are what the process does. A chart with spec limits is just a run chart with extra lines that tell you nothing about process stability.
Specification Limits vs. Control Limits
What teams do
- Plot engineering tolerances on the chart.
- React only when parts fall outside specification.
- Miss slow process drifts that remain inside tolerance.
- Assume good parts equal a stable process.
What works
- Calculate control limits from actual process data.
- React to non-random patterns and special causes.
- Identify shifts long before parts breach tolerance.
- Maintain independent visibility of spread and centre.
The Cost of Fake SPC Programs
Running a fake SPC program is worse than running no program at all. Leadership believes the process is under control because charts exist on the wall. Decisions are made based on that false assumption. When defects inevitably reach the customer, everyone acts surprised, but they shouldn't be. Nobody was actually monitoring the charts.
The resources wasted are staggering. Operators spend hours recording data nobody uses. Quality engineers spend days reviewing charts that failed to prevent the latest 8D corrective action. Bad SPC actively destroys value by consuming the time your team could spend on real problem-solving.
Worst of all, fake SPC provides audit immunity. A facility with walls of beautiful charts passes VDA 6.3 and IATF 16949 audits because auditors check for the existence of charts, not the quality of the analysis. The program protects the facility from audit findings while leaving the process completely uncontrolled. The audit becomes an enabler of dysfunction.
Building a Functional SPC System
Moving from chart theatre to real process control requires discipline. Pick the right characteristics using your PFMEA. Start with three to five critical dimensions per line. Calculate control limits from real data captured over 25 to 30 subgroups under normal conditions. If points fall out of control during this baseline study, find out why, fix it, and recalculate.
Train operators until they can explain the difference between common and special cause in their own words. Post clear reaction plans next to each chart. When a point goes out of control, the operator must know exactly what to do: check the material lot, verify the tooling, inspect the last five parts, notify the team leader. Ambiguity is the enemy of control.
Recalculate limits when the process legitimately changes. New tooling, new material, new method—these require a new baseline. Review charts in weekly production meetings, not monthly. Put the chart on the screen. If the leadership team cannot explain what the chart is telling them, you have identified the core problem.
SPC Baseline Requirements
The Leadership Shift Required
Shewhart’s insight was not merely statistical; it was philosophical. The hardest part of managing a process is knowing when to act and when to leave it alone. Act on common cause variation and you make things worse. Ignore special cause variation and you let the process drift. SPC provides the exact framework required to make that decision correctly.
Most facilities fail at SPC not because the statistics are hard, but because the discipline is hard. It requires the patience to not react to noise. It requires the rigour to investigate signals. It requires the consistency to maintain limits, update reaction plans, and close the loop on out-of-control conditions over years, not weeks.
Leadership must treat SPC data the way a CEO treats financial data: as a dashboard revealing whether the system is healthy. Plant managers must walk the floor, look at the charts, and ask questions. When leadership shifts from checking compliance to seeking understanding, the culture follows. SPC done right detects problems before they produce defects, turning manufacturing from a guessing game into a learning system.