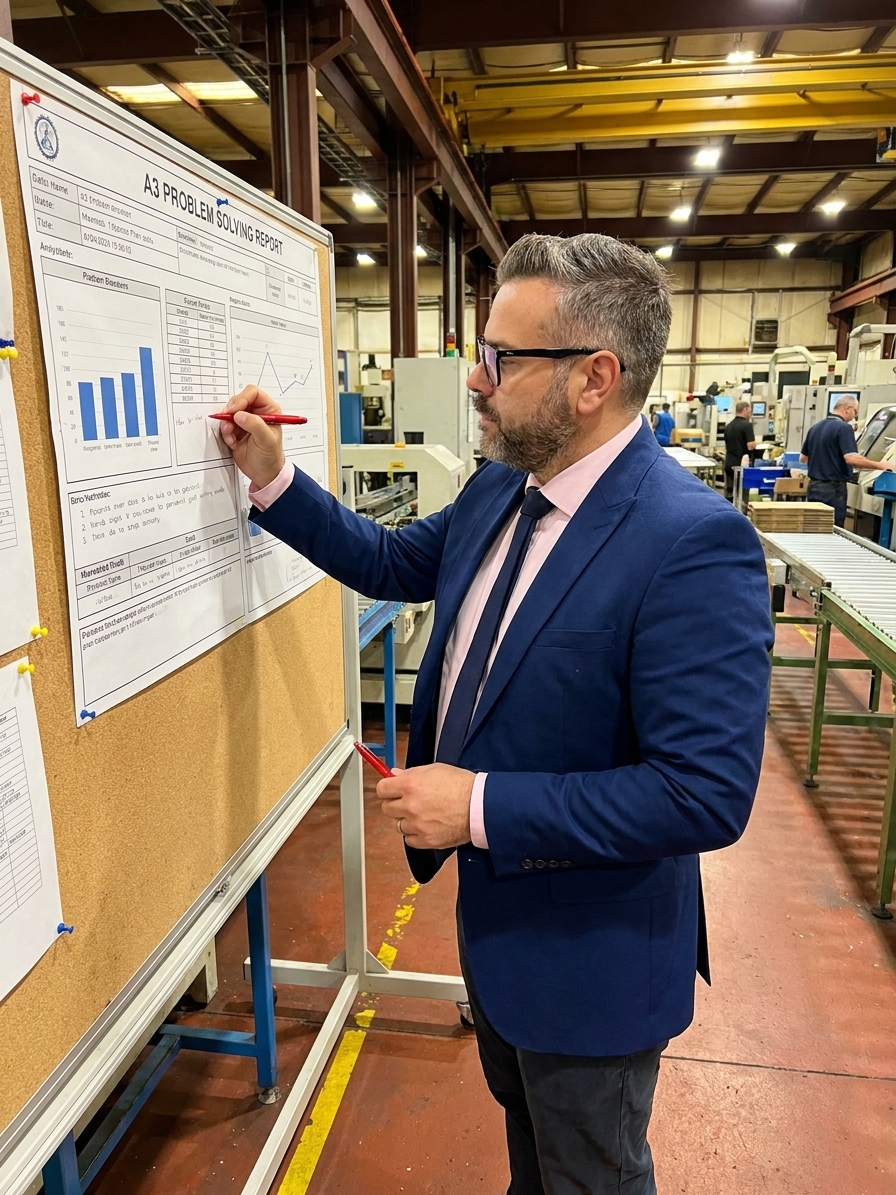
The A3 report originated at Toyota as a structured problem-solving methodology, named after the international paper size on which it was originally written. The physical constraint of one page was deliberate. It forces discipline. You cannot hide behind a forty-slide deck or bury the root cause analysis on page twelve. The single sheet demands that you be concise, specific, and brutally honest about the gap between the current state and the target condition.
Today, the format has widely outpaced the function. I have audited plants where the shared drive holds three conflicting A3 templates because Quality, Engineering, and Operations could not agree on a format. The resulting documents are meeting notes reformatted into boxes. The root cause analysis contains a single sentence. The follow-up section says 'Monitor.' Nobody ever revisits a closed A3 to verify that the countermeasure actually worked.
This is what happens when a thinking tool becomes a documentation requirement. The form survives. The thinking dies. The organisation counts closed A3s as a metric, completely unaware that the conditions producing their defects remain entirely unchanged. You get the administrative overhead of problem-solving with none of the actual problem-solving.
The Anatomy of a Functional A3
A proper A3 follows a left-right narrative flow, reading like a story with a clear beginning, middle, and end. The left side captures the current state: the problem background, the as-is process, and the measurable gap between where you are and where you need to be. It requires quantitative data, not narrative opinions. Vague statements about quality issues have no place here.
The right side lays out the future state: the target condition, proposed countermeasures, an implementation plan with deadlines, and the specific follow-up metrics that will confirm whether the fix actually fixed anything. The centre of the document is the root cause analysis. Everything before it builds toward identifying the true cause. Everything after it flows from that identification.
If the root cause analysis is weak, the entire A3 is a work of fiction. Toyota taught that the A3 was not a form to be filled out but a process to be lived through. The author, typically the person closest to the problem, goes to the gemba. They observe the process, gather data, construct a current-state map, ask why five or more times, test hypotheses, and present findings to a coach who challenges every assumption.
Root Cause Analysis Theatre
The first sign of A3 degradation is when management demands a standardised template. Once the format becomes the deliverable, people optimise for the format. They fill in the boxes. They write something in every section, even if they have nothing meaningful to say. The template, designed to guide structured investigation, becomes a checklist designed to demonstrate compliance during the next ISO 9001 or IATF 16949 audit.
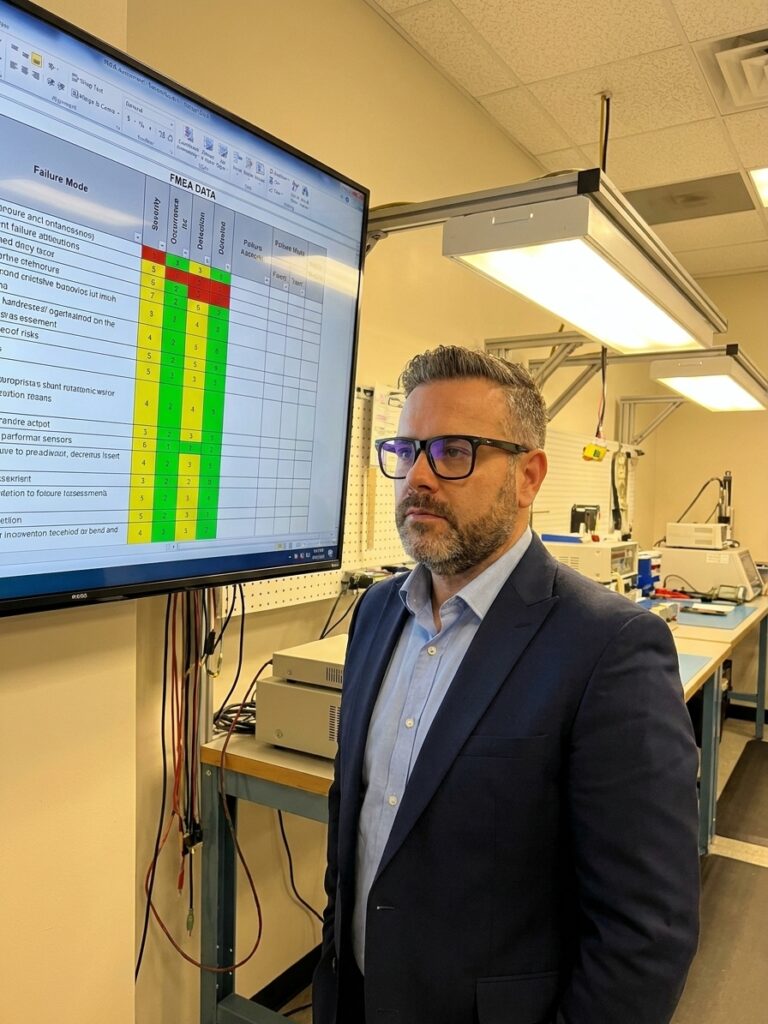
In practice, the root cause analysis section is where this theatre is most visible. You will typically find one of three scenarios. The first is 'operator error.' This is not a root cause. It is a symptom wearing a root cause's clothing. People do not make errors in well-designed systems. They make errors in systems that set them up to fail through ambiguous work instructions, poorly designed fixtures, or excessive cognitive load.
The second scenario is 'inadequate training.' If the solution to every problem is more training, then training is not the problem. The process is. A process that requires constant retraining to perform correctly is a process that has not been mistake-proofed. It has not been designed for the humans who actually have to execute it under real production pressure.
The third scenario is the single, unsupported statement. 'Root cause identified as worn tooling in Station 4.' There is no Ishikawa diagram. There is no data showing the correlation between tool wear and defect rate. There is no discussion of why the tool wear was not detected by the existing preventive maintenance system. A real root cause analysis takes up a quarter of the page. It shows the chain of reasoning and holds up under cross-examination.
From Symptom to Systemic Root Cause
- 01Problem IdentificationDefine the defect in measurable terms, tied to a specific station and part number.
- 025-Why InterrogationPush past the immediate physical cause to interrogate the process and system conditions.
- 03Hypothesis TestingGather correlated data to prove the relationship between the suspected cause and the defect.
- 04Systemic Root CauseIdentify the specific process, fixture, or programme failure that must be eliminated.
Countermeasures vs. Wishes
A countermeasure must directly address the validated root cause. If the root cause is that a fixture allows a part to be loaded in two orientations, the countermeasure must physically prevent the incorrect orientation. That is a countermeasure. It eliminates the root cause permanently. It does not rely on human perfection or sustained vigilance across a ten-hour shift.
What you typically see on failed A3s is a list of wishes and administrative actions. You see phrases like 'Reinforce the importance of correct loading procedure.' This assumes the operator, once reminded, will henceforth load correctly forever, despite fatigue and increasing production rates. It assumes away the fundamental principle of Lean manufacturing: people are not the problem, the system is.
Another common false countermeasure is 'Update the work instruction.' Updating a document does not change what happens on the shop floor unless you also change the physical conditions that produce the defect. An updated work instruction sitting in a binder six feet from the workstation is not a countermeasure. It is paper.
Similarly, 'Implement periodic inspection' is detection, not prevention. Inspection catches defects after they occur. It adds cost through sorting and rework without addressing the conditions that create the defect. Inspection as a countermeasure is an admission that you have given up on prevention and are now just trying to catch the bad parts before the customer does.
The Follow-Up That Never Follows Up
The follow-up section of an A3 must specify exactly what metric will be measured, by whom, at what interval, for how long, and what will happen if the countermeasure fails. In practice, this section usually contains the word 'Monitor' or 'Ongoing observation.' These are not follow-up plans. These are phrases that sound like follow-up plans but require zero commitment from the organisation.
A closed A3 whose countermeasure was never verified is not a solved problem. It is an unvalidated hypothesis filed under 'done.' The defect continues to occur, or it migrates to a different station, and because the A3 is closed, nobody connects the new outbreak to the supposedly resolved issue. The administrative system reports success while the shop floor continues to bleed.
A functional follow-up plan states the baseline and the target explicitly. It dictates that the defect rate at Station 4, measured daily via end-of-line inspection data, must decrease from 3.2% to below 0.5% within thirty days. It assigns a specific owner. Most importantly, it dictates that if the rate does not drop to target, the A3 will be reopened and the root cause analysis revisited from scratch.
The purpose of follow-up is to verify that the countermeasure worked. If the defect rate dropped, you have a validated solution and can standardise the work. If it did not, you have new information. Reopening the A3 is not a failure of the methodology; it is the methodology functioning exactly as designed. The defect is still there because your hypothesis was incorrect. You just stopped looking at it.
The template, designed to guide investigation, becomes a checklist designed to demonstrate compliance during the next ISO 9001 audit.
Eliminating the Coaching Gap
Toyota's A3 process included a critical element that most organisations have eliminated entirely: the coach. Every A3 was reviewed by a manager or senior engineer who had been through hundreds of cycles and knew the difference between rigorous thinking and box-checking. The coach did not accept the first draft. They asked probing questions about data volume, direct observation, and alternative hypotheses considered and discarded.
This coaching dialogue was where the actual learning happened. The A3 author would go back to the floor, gather more data, refine the analysis, and return with a stronger document. This cycle might repeat three or four times before the A3 was considered complete. A problem solved superficially will recur, and recurrence costs vastly more in scrap, warranty claims, and customer complaints than the extra iteration ever will.
Most organisations have no coach. The A3 is submitted to a review meeting, projected on a screen, and approved with a generic nod by an audience that has seventeen other A3s to review in the same hour. There is no challenge, no dialogue, no iteration, and no learning. The document is filed, and the dashboard turns green, completely disconnected from the reality of the shop floor.
A3 Review: Box-Checking vs. Coaching Dialogue
The Box-Checking Meeting
- Projected on screen, skimmed by a distracted audience
- Approved with a generic 'looks good'
- No challenge to the stated root cause
- Focus is on completing the document for the audit
The Coaching Dialogue
- Direct challenge of evidence, data, and logic
- Requires return to gemba for more data
- Iterates until reasoning is solid and defensible
- Focus is on permanently eliminating the defect
Rebuilding the Discipline
Rebuilding a degraded A3 process requires a shift in what the organisation values. Stop measuring the number of completed A3s. A well-constructed A3 that takes six weeks and permanently eliminates a problem is worth more than ten A3s completed in a week that change nothing on the floor. Start measuring the number of problems that do not recur. That is the only metric that matters.
Insist on evidence-based root cause analysis. No A3 should be accepted with 'operator error' or 'inadequate training' as the terminal root cause. Require a five-why analysis supported by data. If the reasoning does not hold up to questions in the review meeting, send it back. Mandate that every A3 author has observed the actual process in person, with a stopwatch and a notebook, before writing the current-state section.
Verify every countermeasure. No A3 should be closed until the follow-up data confirms that the defect rate has dropped to the target level and remained stable for a defined period. Assign a competent coach. Someone in your organisation, whether a senior quality engineer, a Lean practitioner, or an experienced manager, must review each A3 with rigor and challenge the author to think harder. Without coaching, the practice will inevitably degrade again.
The paper has no power. The paper cannot solve problems or force honesty. What gives the A3 its power is the thinking that goes into it: the observation, the data, the reasoning, and the humility to admit when your first hypothesis was wrong. The fix is not a new template. The fix is caring enough about your operational problems to actually dismantle them. One page, one problem, rigorous thinking.