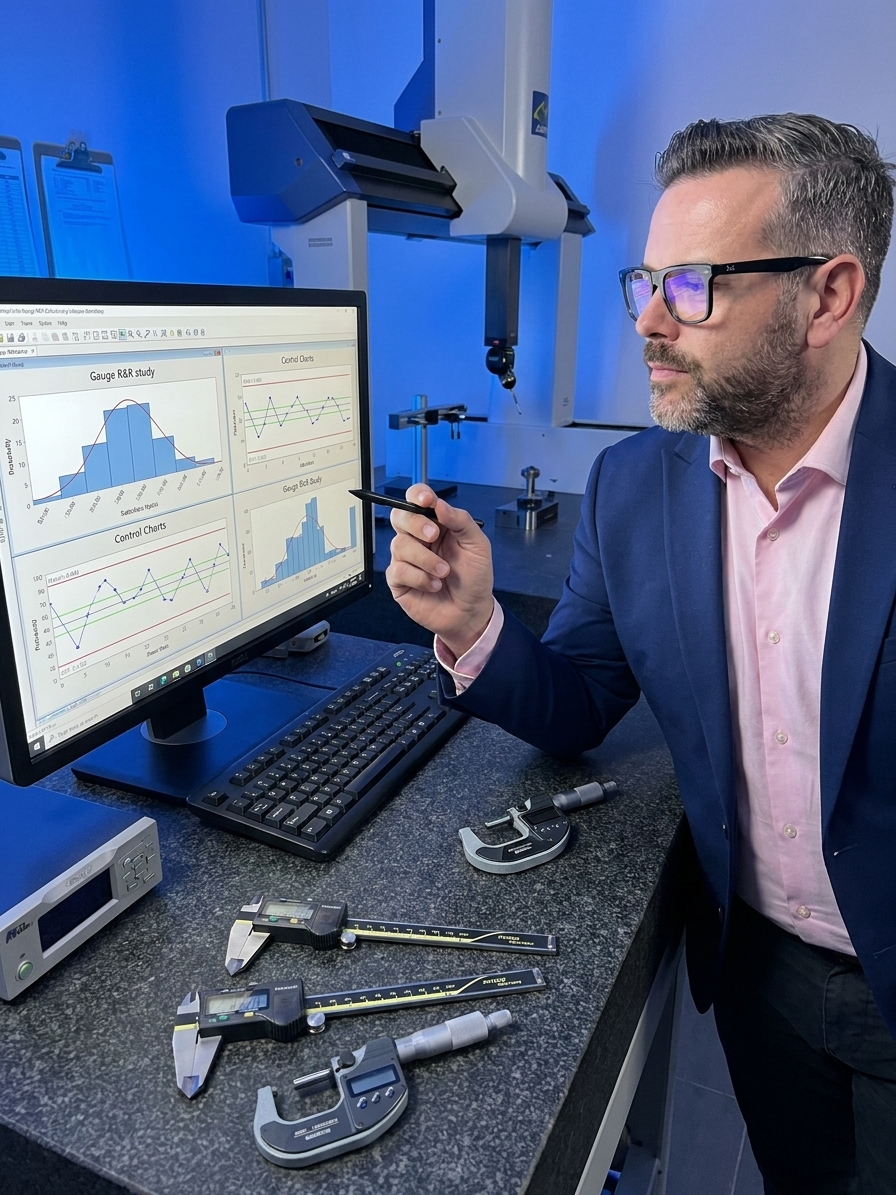
An operator measures a critical dimension on a precision-machined part. The reading comes in at 24.97 mm against a specification of 25.00 ± 0.05 mm. The part is rejected, the supervisor reviews the result, scrap is recorded, and everyone moves on. Nobody asks the one question that determines whether the decision was valid: can we trust the number?
The gauge was calibrated last quarter. The operator followed the procedure. And yet, the act of assigning a number to a physical characteristic introduces variation that the calibration certificate never captures. The part might have been perfectly in spec. The measurement system might have added enough noise to push the reading outside the tolerance band.
This is the problem that Measurement Systems Analysis exists to solve. It is also the problem most organisations think they have already eliminated, because they confuse calibration with capability. Calibration confirms accuracy against a reference artefact. MSA reveals whether your gauge, in the hands of your operators, produces data good enough to justify the decisions you make.
Calibration Is Not Measurement System Capability
Calibration answers a narrow question: does this instrument measure a known standard accurately under controlled conditions? MSA answers the question that actually matters on the shop floor: when real people use this tool on real products, how much of the variation in the numbers comes from the parts, and how much comes from everything else?
A gauge can pass calibration and still be entirely inadequate for its application. I have seen calibrated coordinate measuring machines produce repeatability so poor that every measurement was a coin flip. I have seen hand-held calipers that operators treated as unreliable, and the MSA proved the operators right.
The instrument alone does not determine data quality. The measurement system does. That system includes the gauge, the operator, the part, the method, the environment, and the interactions between them. A study that isolates only the instrument misses the variation that actually drives bad decisions.

The Five Characteristics of a Valid Study
A proper MSA evaluates five characteristics: bias, linearity, stability, repeatability, and reproducibility. Skipping any of them leaves a blind spot. Bias is the systematic difference between the observed average of measurements and the reference value. If your gauge consistently reads high, every measurement carries that offset.
Linearity asks whether bias changes across the measurement range. A gauge might be accurate at the low end of its scale and increasingly biased at the high end. I worked with a manufacturer whose height gauge showed excellent bias at 10 mm but unacceptable bias above 50 mm. They had been accepting or rejecting parts based on a single correction table built from the low-end reference.
Stability means the system performs consistently over time. Most organisations never check it. They run a Gage R&R during initial qualification, file the report, and assume the system remains adequate. It is the equivalent of checking tyre pressure once and never again. Wear, contamination, and temperature drift make yesterday's MSA irrelevant today.
Repeatability is the instrument's inherent precision. Reproducibility is the variation between operators. Low repeatability is often caused by gauge resolution insufficient for the tolerance, inadequate fixturing, or environmental factors. Reproducibility problems usually stem from differences in technique, pressure, or interpretation of the method.
Selecting the Right Study Type
The MSA reference manual defines several study types, and organisations frequently confuse them. Understanding which study answers which question is essential for efficient analysis. A Type 1 study isolates the instrument from the human. A Type 2 study, the standard Gage R&R, evaluates the full system. A Type 3 study applies when the process is automated.
Type 1 is your starting point. It evaluates gauge bias and repeatability using a reference standard. If the gauge cannot accurately and repeatably measure a known artefact, there is no point proceeding to a full Gage R&R. Fix the instrument first.
Type 2 is the workhorse of production quality. The standard crossed Gage R&R study uses 10 parts, 3 operators, and 3 trials per part per operator, yielding 90 measurements. It partitions total observed variation into part-to-part variation, which you want, and measurement system variation, which you must minimise.
| Study Type | Evaluates | When to Apply |
|---|---|---|
| Type 1 | Gauge bias and repeatability against a reference standard. | Initial qualification, after repair or recalibration. |
| Type 2 (Gage R&R) | Repeatability and reproducibility using actual parts and operators. | Production qualification, PPAP submission, periodic re-verification. |
| Type 3 | Repeatability only, removing operator influence. | CMM programmes, vision systems, automated gauging. |
Interpreting the Acceptance Thresholds
When the calculations are done, the primary output is the percentage of total variation attributable to the measurement system (%GRR). The AIAG MSA Reference Manual defines three bands. Under 10% is acceptable. Between 10% and 30% is conditionally acceptable based on cost, characteristic criticality, and available alternatives. Over 30% is unacceptable.
AIAG %GRR Acceptance Criteria
These guidelines do not account for part selection, which heavily influences the result. If all ten parts in your study are nearly identical, part-to-part variation will be artificially low, and %GRR will be inflated. A gauge that performs well in production can appear to fail because the study sampled the wrong parts.
Select parts that represent actual production variation. Do not pick the first ten off the line, and do not hand-pick extremes. Random sampling across shifts, machines, and time periods gives the study statistical integrity and prevents false failures.
Attribute Systems and the Hidden Cost of Noise
Most MSA discussion focuses on variable data. Many quality characteristics, however, are attribute data: pass/fail, go/no-go, visual inspection. These systems need analysis too, and they are almost never studied. Attribute agreement analysis measures consistency within inspectors, between inspectors, and against a known standard.
When two inspectors looking at the same part disagree 30% of the time, the inspection data is not informing decisions. It is adding noise.
I conducted an attribute MSA for an automotive supplier whose visual inspection station was rejecting 8% of production. The primary inspector agreed with herself only 82% of the time and agreed with the reference standard 74% of the time. The company was scrapping conforming parts and shipping nonconforming ones based on a system that was essentially guessing.
The consequences of unquantified measurement error extend far beyond scrap. False accepts send nonconforming product to customers, undiscovered until the defect surfaces downstream. Wasted engineering effort occurs when teams chase process variation that does not exist, because the signals on the control chart are generated by the gauge, not the process.
If your measurement system contributes 30% of total variation, your Cpk is inflated by measurement noise. You might believe you are running at Cpk 1.33 when the process itself, isolated from error, is only capable of 1.15. Every downstream decision inherits this unreliability.
A Disciplined Approach to Improvement
Improving a measurement system requires sequence and discipline. Start with stability. Without a stable process, no other characteristic is meaningful. Run a stability study over a minimum of four weeks using a master part measured under production conditions. If the control chart shows a trend or shift, eliminate the cause before proceeding.
Assess bias and linearity using calibrated reference standards traceable to national standards. If bias is significant or non-linear, the gauge needs adjustment or a new correction table. Then conduct a full Gage R&R with properly selected parts and trained operators.
Analyse the breakdown. If operator variation dominates, standardise the method. Write clear work instructions, create fixture-guided setups, and verify competence through repeated trials. If gauge variation dominates, evaluate resolution, fixture design, environmental isolation, and contact force. Sometimes the solution is simply adding a better clamping mechanism or isolating vibration.
Re-run the study after changes and document everything. The MSA file should tell a complete story: what was found, what was changed, what improved. The organisations that take this discipline seriously are the ones whose capability studies reflect reality and whose scrap rates represent genuine nonconformance.