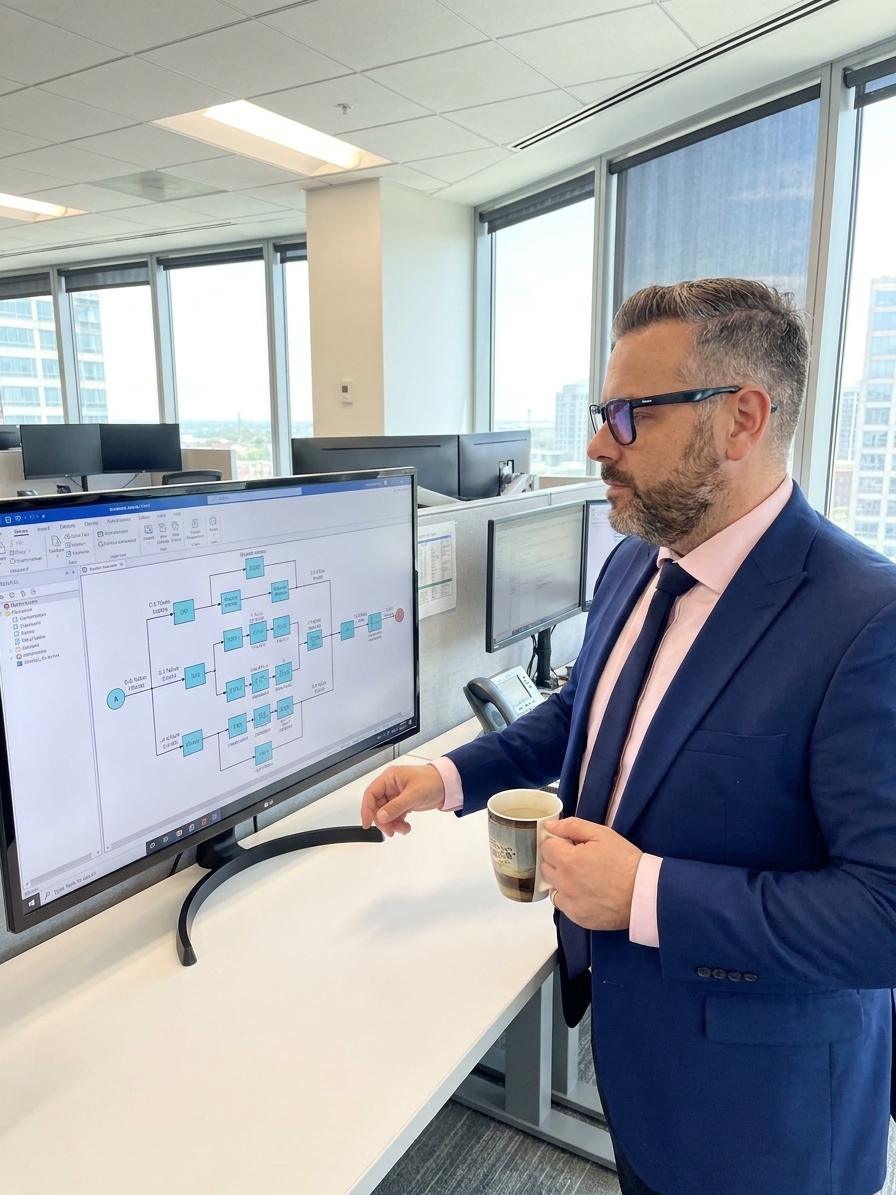
Fault Tree Analysis (FTA) is a top-down, deductive method for identifying the combinations of failures that can lead to a specific undesirable event. Developed in 1962 by H.A. Watson at Bell Laboratories under a U.S. Air Force contract for the Minuteman missile system, FTA answers a single rigorous question: what combinations of events cause this system to fail? The method begins with a top event and works downward through Boolean logic gates to map every credible path to that outcome.
When executed and maintained correctly, FTA delivers capabilities no other single quality tool provides. It generates a visual map of causality that engineers, operators, and management can trace together, forcing implicit assumptions out into the open. It provides quantitative risk estimation by assigning probability values to basic events, allowing you to calculate the likelihood of the top event using Boolean algebra. Finally, it establishes a mathematical foundation for risk reduction by highlighting exactly which interventions deliver the greatest return on investment.
Yet across manufacturing organisations, the reality of FTA is entirely different. I have audited plants where leadership mandated a complex fault tree after a major incident, only to let it fossilise into an unmaintained artifact. The cross-functional team assembles, debates gate logic for weeks, and produces a magnificent diagram stretching across conference room walls. The analysis is filed, referenced in the initial risk assessment, and then never meaningfully updated. The reliability engineer who built it transfers sites, the source file is lost, and the diagram becomes engineering theatre.
The Dysfunctional Fault Tree Patterns
The most common dysfunction is treating the fault tree as a static deliverable rather than a living model. Teams pour energy into making the diagram visually perfect—aligning gates, color-coding branches, adding corporate logos—while neglecting the analytical work that gives the tree its power. A fault tree that has never been used to evaluate a design change, test a maintenance strategy, or prioritise capital investment is not an analysis. It is decoration.
The real deliverable is the understanding the tree creates: which single points of failure matter most, which redundancies are illusory, and where common-cause events undermine independence assumptions. What follows the initial construction is a slow erosion of value. Nobody updates the tree, and by the time the next failure occurs, the diagram bears no resemblance to the modified equipment, revised procedures, and new failure modes that have crept in over the intervening years.
Stale probability values further compromise the analysis. Quantitative FTA depends on failure rates, human error probabilities, test intervals, and repair times sourced from vendor data, industry databases, or site-specific records. Equipment ages, maintenance practices evolve, and operating conditions shift. A valve that failed once every five years when new might fail annually after fifteen years of service, yet many fault trees retain their original probability values indefinitely, lending false numerical authority to engineering decisions.
The Common-Cause Failure Blind Spot
Common-cause failure analysis is the most technically demanding and most frequently neglected aspect of FTA. When two or more components fail simultaneously due to a shared cause—a common power supply, a shared maintenance technician, or identical software running redundant controllers—the independence assumption that underpins redundancy collapses. Many fault trees model redundant components as entirely independent events.
By connecting redundant components through simple AND gates, organisations dramatically underestimate the probability of simultaneous failure. A skilled analyst will add beta-factor models or explicit common-cause basic events to capture these dependencies. However, this requires expertise that many organisations lack, and the temptation to skip it is strong because it simplifies the tree considerably.
The result is a tree that looks robust on paper but fails in practice. The diagram displays redundant paths, backup systems, and safety margins, but the common-cause event that takes down both the primary and backup systems was never modelled. When an actual failure occurs, the investigation should trace the real causal path and compare it against the tree to validate gate assignments and probabilities. This validation step almost never happens.
Defining the Top Event and Cut Sets
The most critical decision in any fault tree analysis is how you define the top event. 'System failure' is too broad—it generates an unmanageable tree with ambiguous branches. 'Pump P-101 fails to deliver required flow during startup' is specific, bounded, and analyzable. A well-defined top event describes an observable state, has a clear time window, and relates to a consequence the organisation cares about.
Once the tree is built, minimal cut set analysis identifies the smallest combinations of basic events that can trigger the top event. A cut set with a single event means one failure causes the top event—a critical vulnerability. A cut set with three events means three independent failures must align simultaneously, which is generally far less probable.
This analysis transforms a sprawling diagram into actionable intelligence. Instead of staring at ninety-three basic events, you focus on the five or six minimal cut sets that contribute most to the top event probability. These combinations become your priority targets for risk reduction, maintenance focus, and capital investment.
| Cut Set Order | Risk Level | Typical Response |
|---|---|---|
| 1 (single point of failure) | Critical | Add redundancy or eliminate the failure mode |
| 2 | High | Evaluate common-cause dependencies and test coverage |
| 3+ | Moderate | Monitor through normal maintenance and inspection |
Assigning Probabilities and Tools Honestly
Resist the temptation to assign round numbers from generic databases and move on. The most valuable probability data is site-specific: your maintenance records, your failure histories, your operational data. Even a rough estimate based on five years of actual plant experience beats a precise number from a handbook designed for different equipment operating in entirely different conditions.
Where data is genuinely unavailable, use ranges rather than point values. Perform sensitivity analysis to identify which probability assumptions dominate the top event calculation. If the result hinges on one uncertain value, that tells you exactly where to invest in better data collection mechanisms.
A tree with stale probabilities is worse than no tree at all, because it lends numerical authority to decisions better made with honest engineering judgment.
Modern FTA software tools—such as PTC Windchill FTA, Isograph FaultTree+, BlockSim, and open-source options like SCRAM—support dynamic updating, probability recalculation, and minimal cut set analysis. They maintain version history so you can trace exactly when and why the tree changed. A fault tree drawn in Visio or PowerPoint cannot do any of these things. If your organisation is serious about FTA, invest in proper tooling.
Integrating FTA with the Quality System
A fault tree should not exist in isolation. It belongs in the quality management system as a living document that connects directly to other processes. Design reviews must reference the tree when evaluating proposed changes. A new component substitution, a revised maintenance interval, or a procedural update should automatically trigger a single question: how does this affect the fault tree?
Management of Change (MOC) procedures should include a mandatory step requiring the requester to assess whether the change affects any active fault tree. This is not bureaucratic overhead; it is the mechanism that keeps the tree alive. Incident investigations should close the loop by mapping actual failure paths against the tree. When reality diverges from the model, you update the model. That is how the tree learns.
Periodic reviews—at minimum annually, or whenever significant configuration changes occur—must verify that the tree reflects current equipment, current procedures, and current operating data. Organisations that treat FTA as a compliance artifact produce trees that look impressive and deliver nothing. Teams that treat FTA as a thinking tool use it to challenge assumptions, expose hidden dependencies, and make their systems demonstrably safer.
Fault Tree Maintenance Cycle
- 01Define EventEstablish a specific, bounded top event tied to an observable state.
- 02Build and MapMap logic gates and assign honest, site-specific probabilities.
- 03Identify Cut SetsCalculate minimal cut sets to prioritise critical vulnerabilities.
- 04IntegrateConnect the tree to MOC, design reviews, and incident investigations.
- 05ValidateCompare real failure paths against the model and update discrepancies.
Practical Steps to Revive a Dead Fault Tree
If your organisation has a fault tree that has been sitting untouched, pull the most recent version and identify the top event. Gather the people who understand the current system—operators, maintenance technicians, engineers—and walk the tree together. At each branch, ask if this still reflects how the system works. Note any discrepancies regarding equipment, procedures, personnel, or operating conditions.
These discrepancies are your update items. Prioritise them by their impact on the minimal cut sets—a change that affects a single-point-of-failure path comes first. Assign a specific owner. Not a department, but a person whose name is on the tree, who is accountable for its accuracy, and who reviews it at defined intervals. Without a named owner, the tree will decay again.
Finally, connect the tree to a real decision. Use it to evaluate one pending action—a maintenance interval change, a spare parts analysis, a procedure revision. Let the tree inform the decision, and document that it did. Teams that get value from fault tree analysis are comfortable with uncertainty, encourage dissent during gate construction, and accept that a fault tree is never finished. It either evolves with the system it represents, or it becomes a lie.