
An automotive supplier once handed me a failure report that defied conventional logic. The plant had recorded three years of perfect delivery to a major OEM, with zero warranty claims. Then, within a single six-week window, the customer reported four distinct field failures. The defects spanned different components, different error modes, and different production shifts. The only common denominator was the end customer and the final assembly line.
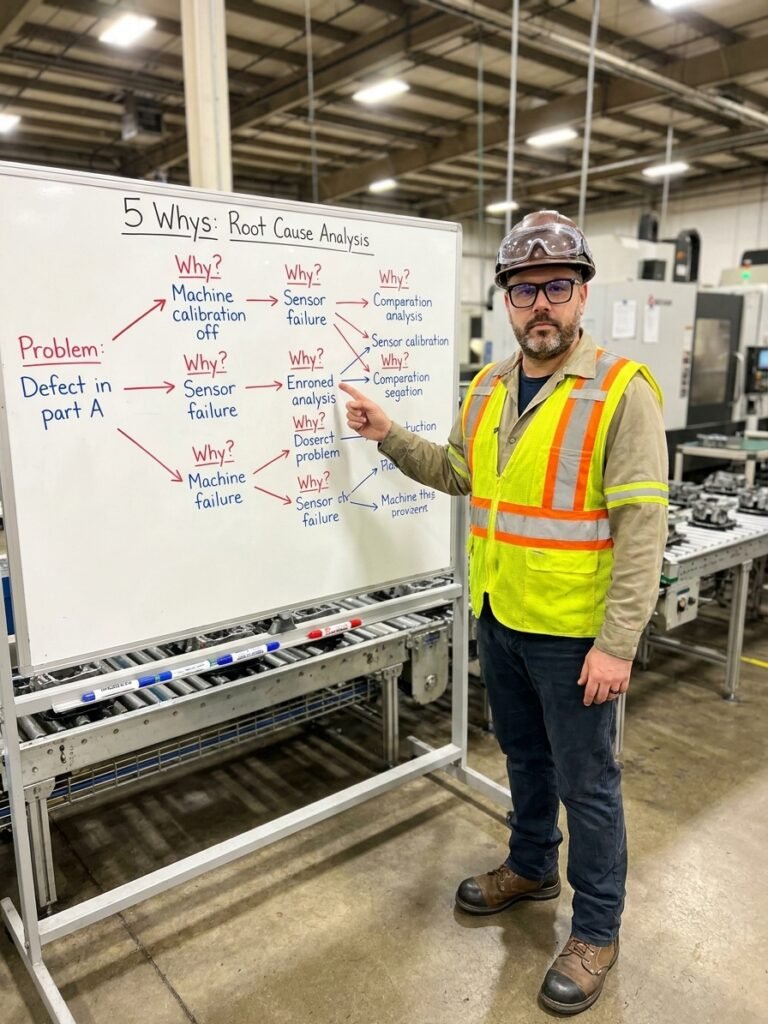
The quality team had dutifully run 5-Why on each individual defect. They generated three distinct root causes and implemented corrective actions for each one. The field failures continued unabated. They were treating the symptoms because the tool they used is designed to look for a single linear chain of events. Complex systems rarely fail that way.
They needed Fault Tree Analysis (FTA). FTA is a top-down, deductive analytical method that maps the logical relationships between multiple causes. It does not ask what went wrong in a specific instance. It asks exactly what combination of factors had to align to allow the system to fail. That distinction is what separates symptom-chasing from genuine root cause identification.
The Deductive Logic of Fault Tree Construction
Fault Tree Analysis begins with a precisely defined top event. This is the specific, measurable, undesired outcome you are analysing. "Poor quality" is not a top event; it is a vague symptom. A genuine top event is "sensor signal loss exceeding 50 milliseconds at operating temperatures above 80°C". Vague definitions produce vague trees that cannot be quantified or acted upon by engineering teams.
From this top event, you systematically decompose the failure using Boolean logic gates. An OR gate dictates that the output occurs if any single input event occurs. An AND gate dictates that the output occurs only if all input events occur simultaneously. This logical structure is what separates FTA from Ishikawa diagrams, which merely categorise potential factors into branches without testing their logical dependencies.
This structure allows FTA to expose multi-causal failures. A 5-Why analysis follows a single path to one root cause. FTA reveals that catastrophic failures are frequently the result of two or more independent factors aligning, none of which would trigger the failure on its own. Understanding these logical combinations is the prerequisite for calculating actual system reliability.
Building the Tree Down to Basic Events
Once you define the top event and the first layer of immediate causes, you decompose each branch further using the same AND/OR logic. You continue this decomposition until you reach basic events. Basic events are the fundamental failures, human errors, or environmental conditions that cannot or need not be broken down any further. These are the quantifiable building blocks of your system risk.
Consider a basic event like "electrical connection interrupted". You decompose this through an OR gate into corroded connectors, mechanically damaged cables, or fractured solder joints. You then push deeper. Fractured solder joints might be decomposed through an AND gate into cyclic thermal loading and an inappropriate solder alloy. This is where the physical reality of your process meets the logical framework of the analysis.
The objective is to map every parallel path that leads to the top event. In complex assemblies like automotive electronics or aerospace subsystems, a single top event might generate 40 or 50 basic events distributed across multiple AND and OR gates. The resulting diagram is a complete vulnerability map of the specific failure mode under investigation.
The FTA Decomposition Sequence
- 01Define Top EventState the exact, measurable failure mode (e.g. signal loss > 50ms).
- 02Identify Immediate CausesApply OR and AND gates to the direct technical and systemic triggers.
- 03Push the logic deeper until you reach independent, physical failures.
- 04Reach Basic EventsTerminate at quantifiable component failures or environmental limits.
Identifying Minimal Cut Sets and Single Points of Failure
Once the tree is complete, you analyse it mathematically to identify the Minimal Cut Sets. A Minimal Cut Set is the smallest combination of basic events that will guarantee the top event occurs. If your top event is connected through an AND gate requiring three specific failures, that trio is a cut set. Finding a cut set with only one event identifies a single point of failure in your system design.
If you possess failure rate data for your basic events, you can calculate the precise probability of the top event. For an AND gate, you multiply the probabilities of the input events together. For an OR gate, you calculate the probability of at least one event occurring. This transforms the fault tree from a qualitative drawing into a quantitative risk model.
This quantitative rigour is why aerospace, nuclear energy, and automotive safety sectors rely heavily on FTA. In industries governed by IEC 61508 or ISO 26262, reliability is not a marketing feature; it is a regulatory threshold. Calculating the exact probability of a safety goal violation is mandatory for achieving compliance and product homologation.
FTA Analytical Thresholds
The Multi-Causal Failure Mode in Practice
Returning to the automotive supplier's sensor failures, the resolution required mapping the entire system. Over three days, the engineering team built a fault tree with 47 basic events, 12 OR gates, and 5 AND gates. The tree split into technical branches encompassing hardware and materials, and organisational branches covering training and audit procedures.
The analysis revealed three distinct minimal cut sets leading to the sensor failure. All three cut sets shared a single common basic event: an unvalidated change in the calibration laboratory. The change had been documented in the Change Management system four months earlier, but it had bypassed the required validation audit. This systemic weakness was the invisible thread connecting all four field failures.
Risk rarely resides in a single factor; it thrives in the combination of factors that independently look harmless.
The unvalidated change had shifted the calibration tolerance by a mere 0.3 percent. For 95 percent of the production volume, this deviation was entirely harmless. However, for one specific sensor variant, combined with production-line vibration levels that were technically within specification, and a specific thermal load that was also within specification, the 0.3 percent shift induced a cascade failure. Three factors, all individually within tolerance, aligned to create a catastrophic field failure.
Corrective actions were immediate and systemic. The calibration procedure reverted to original parameters. A dual-independent verification check was implemented for all calibration changes. A specific control point was added to the Control Plan for sensors sensitive to calibration shifts. The result was zero field failures over the following 12 months. The AND gate had been permanently broken.
Common Analysis Errors and System Dependencies
The most frequent error I observe in fault tree construction is a poorly defined top event. "Customer dissatisfaction" cannot be decomposed logically. You must drill down to the specific functional failure the customer experienced. If you start the tree with a symptom, every branch you draw afterwards will be a guess, and the resulting cut sets will be useless to engineering.
Misapplying Boolean logic is equally destructive. Placing an OR gate where an AND gate belongs artificially inflates the calculated risk, driving unnecessary cost into over-engineered solutions. Reversing the error hides genuine catastrophic risks behind false mathematical security. The logic gates must perfectly reflect the physical and functional reality of the system architecture, not the assumptions of the analyst.
Ignoring Common Cause Failures negates the primary benefit of FTA. Two redundant hydraulic pumps provide excellent fault tolerance on paper. If both pumps draw power from the same electrical bus, a single bus failure defeats the redundancy. If your fault tree fails to capture these shared dependencies, your quantitative probability calculations will be dangerously inaccurate.
Integrating FTA within the Quality Ecosystem
Fault Tree Analysis does not replace FMEA or 8D; it refines them. Use FMEA during APQP to identify potential failure modes and their effects across the entire system. When the FMEA highlights a high-risk failure mode, or when an 8D investigation stalls on step D4 due to complex root causes, deploy FTA to model that specific vulnerability in depth.
Reliability Block Diagrams (RBD) offer the inverse perspective of FTA. An RBD models what must function for the system to succeed. FTA models what must fail for the system to break. Advanced engineering teams use both in tandem, validating the success paths of the RBD against the failure paths of the FTA. This dual approach provides a comprehensive view of system reliability.
Software tools like Isograph Reliability Workbench or open-source alternatives are necessary for quantifying complex trees with hundreds of basic events. However, the initial decomposition should always be done on a whiteboard with a cross-functional team. An FTA built by a single engineer in isolation is just one person's opinion encoded into a diagram. The logic requires challenge from design, process, and quality engineering.
If you face a recurring failure that defies conventional 8D logic, stop asking what caused the defect. Start asking what combination of events had to align for the defect to survive your quality controls and reach the customer. Build the tree, define the gates, and let the Boolean logic reveal the systemic weakness hiding in plain sight.