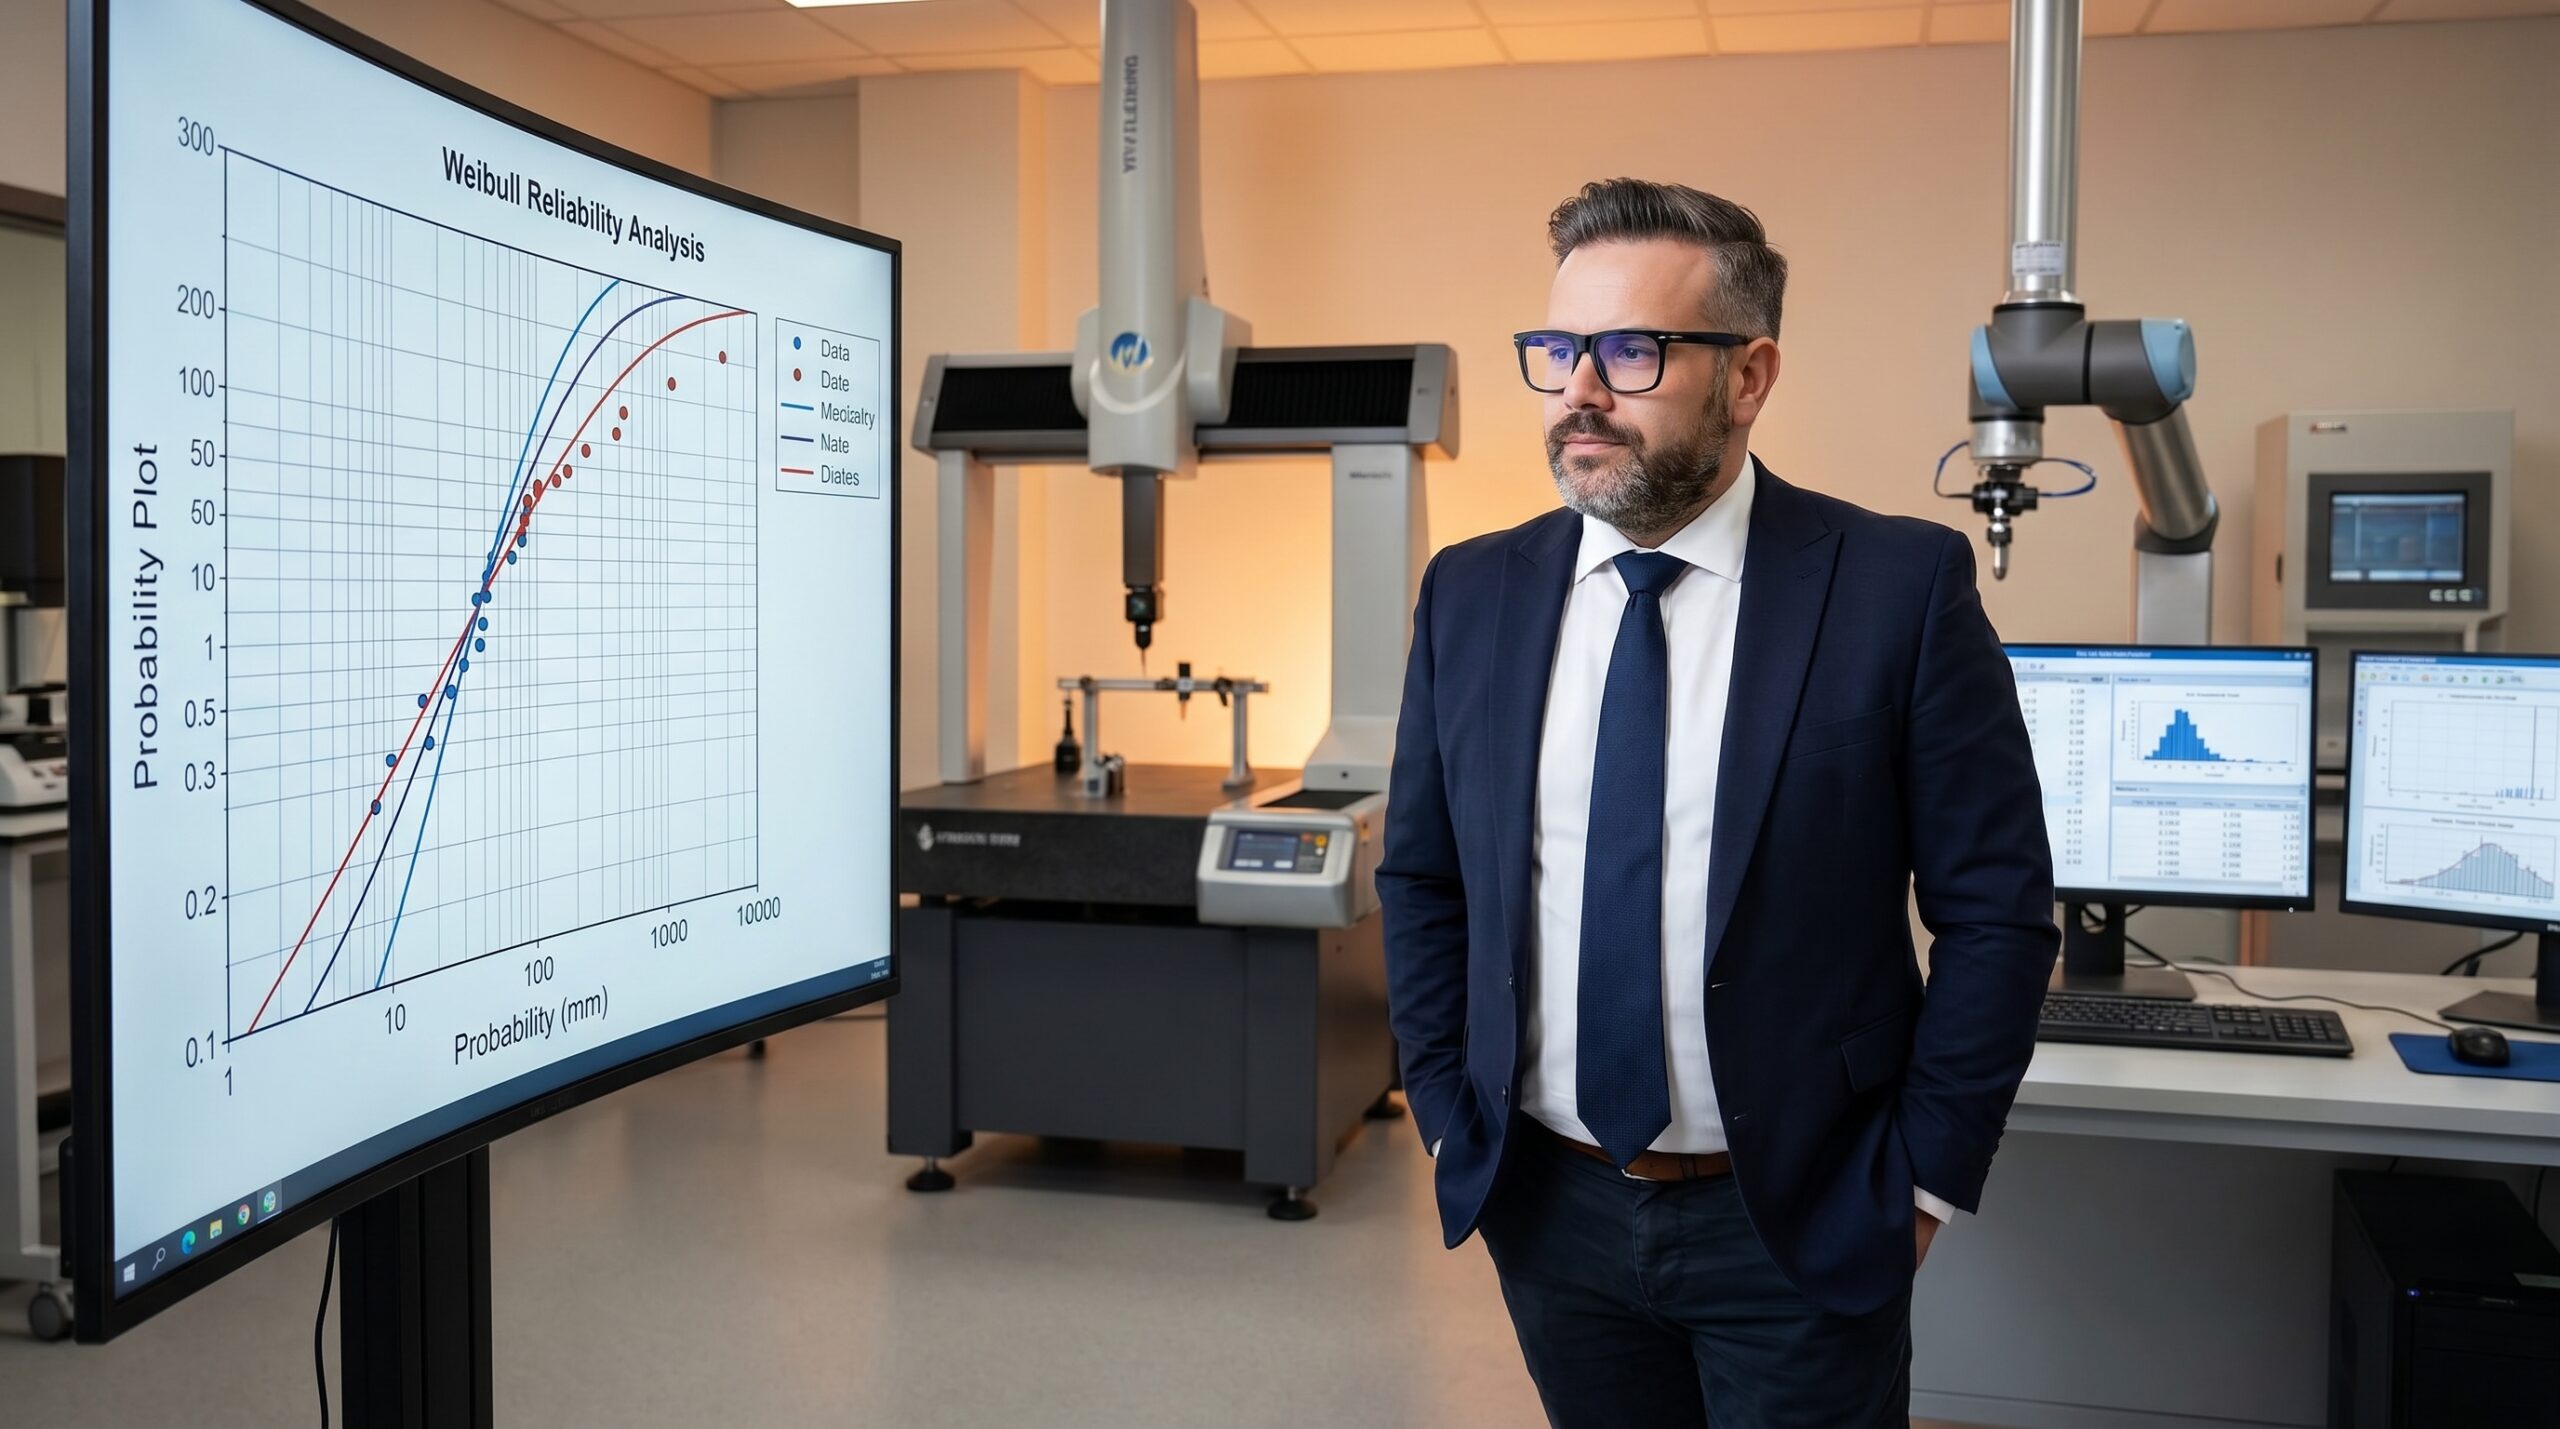
A plant manager from an automotive supply chain called me in November. Warranty costs had jumped 47 % in the previous quarter. Customers were reporting the exact same failure mode across the board: a locking mechanism fracturing after 14 to 18 months in service.
The critical issue was scale. With 120,000 units already in the field, the manager needed to know if this was a random statistical blip or a systematic design flaw. If the latter, the incoming wave of warranty claims would cost them their primary OEM contract.
I requested the full failure dataset: time-to-failure data for the 187 returned units, production dates, and the total active population in the field. Within hours, the data told a clear story. But you need the right mathematical language to read it. This is exactly what Weibull analysis provides.
The Mechanics of Weibull Analysis
Weibull analysis is a statistical method used to model and predict product reliability. Published by Swedish engineer Waloddi Weibull in 1951, it has become the foundational tool in reliability engineering because of its extreme flexibility.
The method uses a probability density function defined by two primary parameters. The first is the shape parameter (β, beta), which dictates the type of failure. If β is less than 1, failures are premature, indicating infant mortality. If β is roughly 1, failures are random. If β is greater than 1, failures are driven by wear-out mechanisms.
The second is the scale parameter (η, eta), which represents the characteristic life. By the time a product reaches this duration in service, approximately 63.2 % of the population will have failed. An optional third parameter, the location parameter (γ, gamma), represents a minimum stress or time period before any failures can occur.

The power of this distribution lies in its adaptability. A single equation can model decreasing, constant, or increasing failure rates. You do not need to force three different models onto your field data — the Weibull distribution adapts to the physical reality of your product.
Separating Failure Modes from Warranty Noise
Many quality engineers treat Weibull analysis as an academic exercise. In reality, it is one of the most practical financial tools available in manufacturing. If you paid out millions in warranty claims last year, you need to know what proportion stems from defective materials versus normal wear-out.
Without this statistical breakdown, your continuous improvement budget is wasted. You might invest heavily in process control to eliminate early-life failures, only to discover that 80 % of your warranty costs are driven by end-of-life wear-out that requires a material upgrade.
Weibull analysis provides a precise map of your risk exposure. It takes ambiguous warranty returns and converts them into actionable failure probabilities. This allows you to target your engineering resources exactly where the physics of failure dictate, rather than relying on institutional guesswork.
Executing the Analysis: Data and Interpretation
The analysis requires time-to-failure data. This can be measured in operating hours, cycles, kilometers, or months in service. Crucially, you must account for both exact failure times and censored data — units that are still operating in the field and have not yet failed.
Ignoring censored data is a critical error that artificially inflates your failure rate. For the automotive client, we combined the failure times of the 187 returned units with the exposure data of the 120,000 units still in use. This censored dataset provides the statistical weight needed for an accurate model.
Data Handling for Reliability Modelling
What teams do
- Analyse only returned, failed units
- Ignore the active field population
- Inflate the apparent failure rate
- Make defensive decisions based on panic
What works
- Log exact time-to-failure for returns
- Record total units still operating (censored)
- Calculate failure rate against the full population
- Model the true probability of future failures
Using maximum likelihood estimation, we calculated the parameters for the locking mechanism. The shape parameter (β) was 2.7. The scale parameter (η) was 16 months. This proved the failures were systematic wear-out, not random chance, and that the failure rate accelerated rapidly after the first year of service.
Quantifying Risk and Taking Action
With the parameters defined, we could predict the exact trajectory of the field population. I calculated the probability of failure at 24 months. The result was 78 %. Out of 120,000 active units, they could expect roughly 93,600 failures within two years. The first 10 % of failures would occur by month 10.
Weibull does not just confirm you have a problem; it tells you the exact month the problem becomes a financial catastrophe.
I presented the data to the plant manager. The mechanism had a clear design limitation causing accumulated material fatigue. Immediate action was required. We halted production of the current design and launched a root cause analysis (RCA) team to investigate the material properties of the sliding element.
The RCA identified that the base polyamide used in the mechanism lacked the necessary long-term mechanical strength. The corrective action was a material substitution. We replaced the standard polyamide with a polyamide reinforced with 30 % glass fibre, directly addressing the wear-out mechanism.
Before committing to full production, we ran accelerated life testing to validate the new design. The results were clear. The characteristic life (η) shifted from 16 months to 38 months. The projected 24-month failure rate plummeted from 78 % to under 5 %. Warranty costs dropped 62 % the following quarter.
Common Statistical Pitfalls
Even robust statistical tools fail when fed bad data or interpreted poorly. Over my career, I have audited plants that completely undermined their reliability predictions by making one of four fundamental errors during the analysis phase.
First, engineers routinely mix failure modes. If your dataset contains failures caused by both corrosion and mechanical fatigue, Weibull will average them into a meaningless parameter. You must stratify your data by failure mode and analyse each mechanism separately to get a valid shape parameter.
Second, extrapolating too far beyond your data range is dangerous. If your field data covers 24 months, projecting failure rates out to 10 years is statistical roulette. The Weibull distribution is a physical model, not a crystal ball. Limit your extrapolations to two or three times your maximum observed failure time.
Third, attempting Weibull analysis with fewer than 20 to 30 failure data points leads to incredibly wide confidence intervals. The parameters become guesswork. Similarly, relying solely on one estimation method without checking the results against rank regression can yield inaccurate results when dealing with small sample sizes.
Correct Data Segregation for Weibull Modelling
- Total Warranty ReturnsThe mixed dataset: contains every failure type, masking the true mechanics of wear.
- Stratified by Failure ModeSeparated into distinct buckets: fracture, corrosion, electrical fault, etc.
- Individual Weibull ModelsRun the analysis separately on each pure failure mode to get accurate β and η values.
Integrating Weibull with Quality Tools
Weibull analysis does not operate in a vacuum. To build a robust AS9100 or IATF 16949 quality management system, you must integrate it with your existing core tools. It acts as a quantitative multiplier for your qualitative risk assessments.
Your PFMEA identifies potential failure modes and scores them based on severity, occurrence, and detection. Weibull analysis provides the actual mathematical probability of occurrence. Where the PFMEA says a failure is critical, Weibull tells you exactly what percentage of the population will fail and when.
Once Weibull identifies a wear-out mechanism (β > 1), you can use Design of Experiments (DOE) to isolate the environmental factors accelerating that wear. The statistical output then directly informs your Control Plan, allowing you to set precise, data-driven intervals for preventive maintenance and final inspection.
You do not need expensive specialised software to begin this journey. Engineers can run initial calculations using standard spreadsheet functions like WEIBULL.DIST. When your reliability requirements demand more rigorous maximum likelihood estimation and visual probability plotting, upgrade to dedicated platforms like Minitab, JMP, or Reliasoft Weibull++.