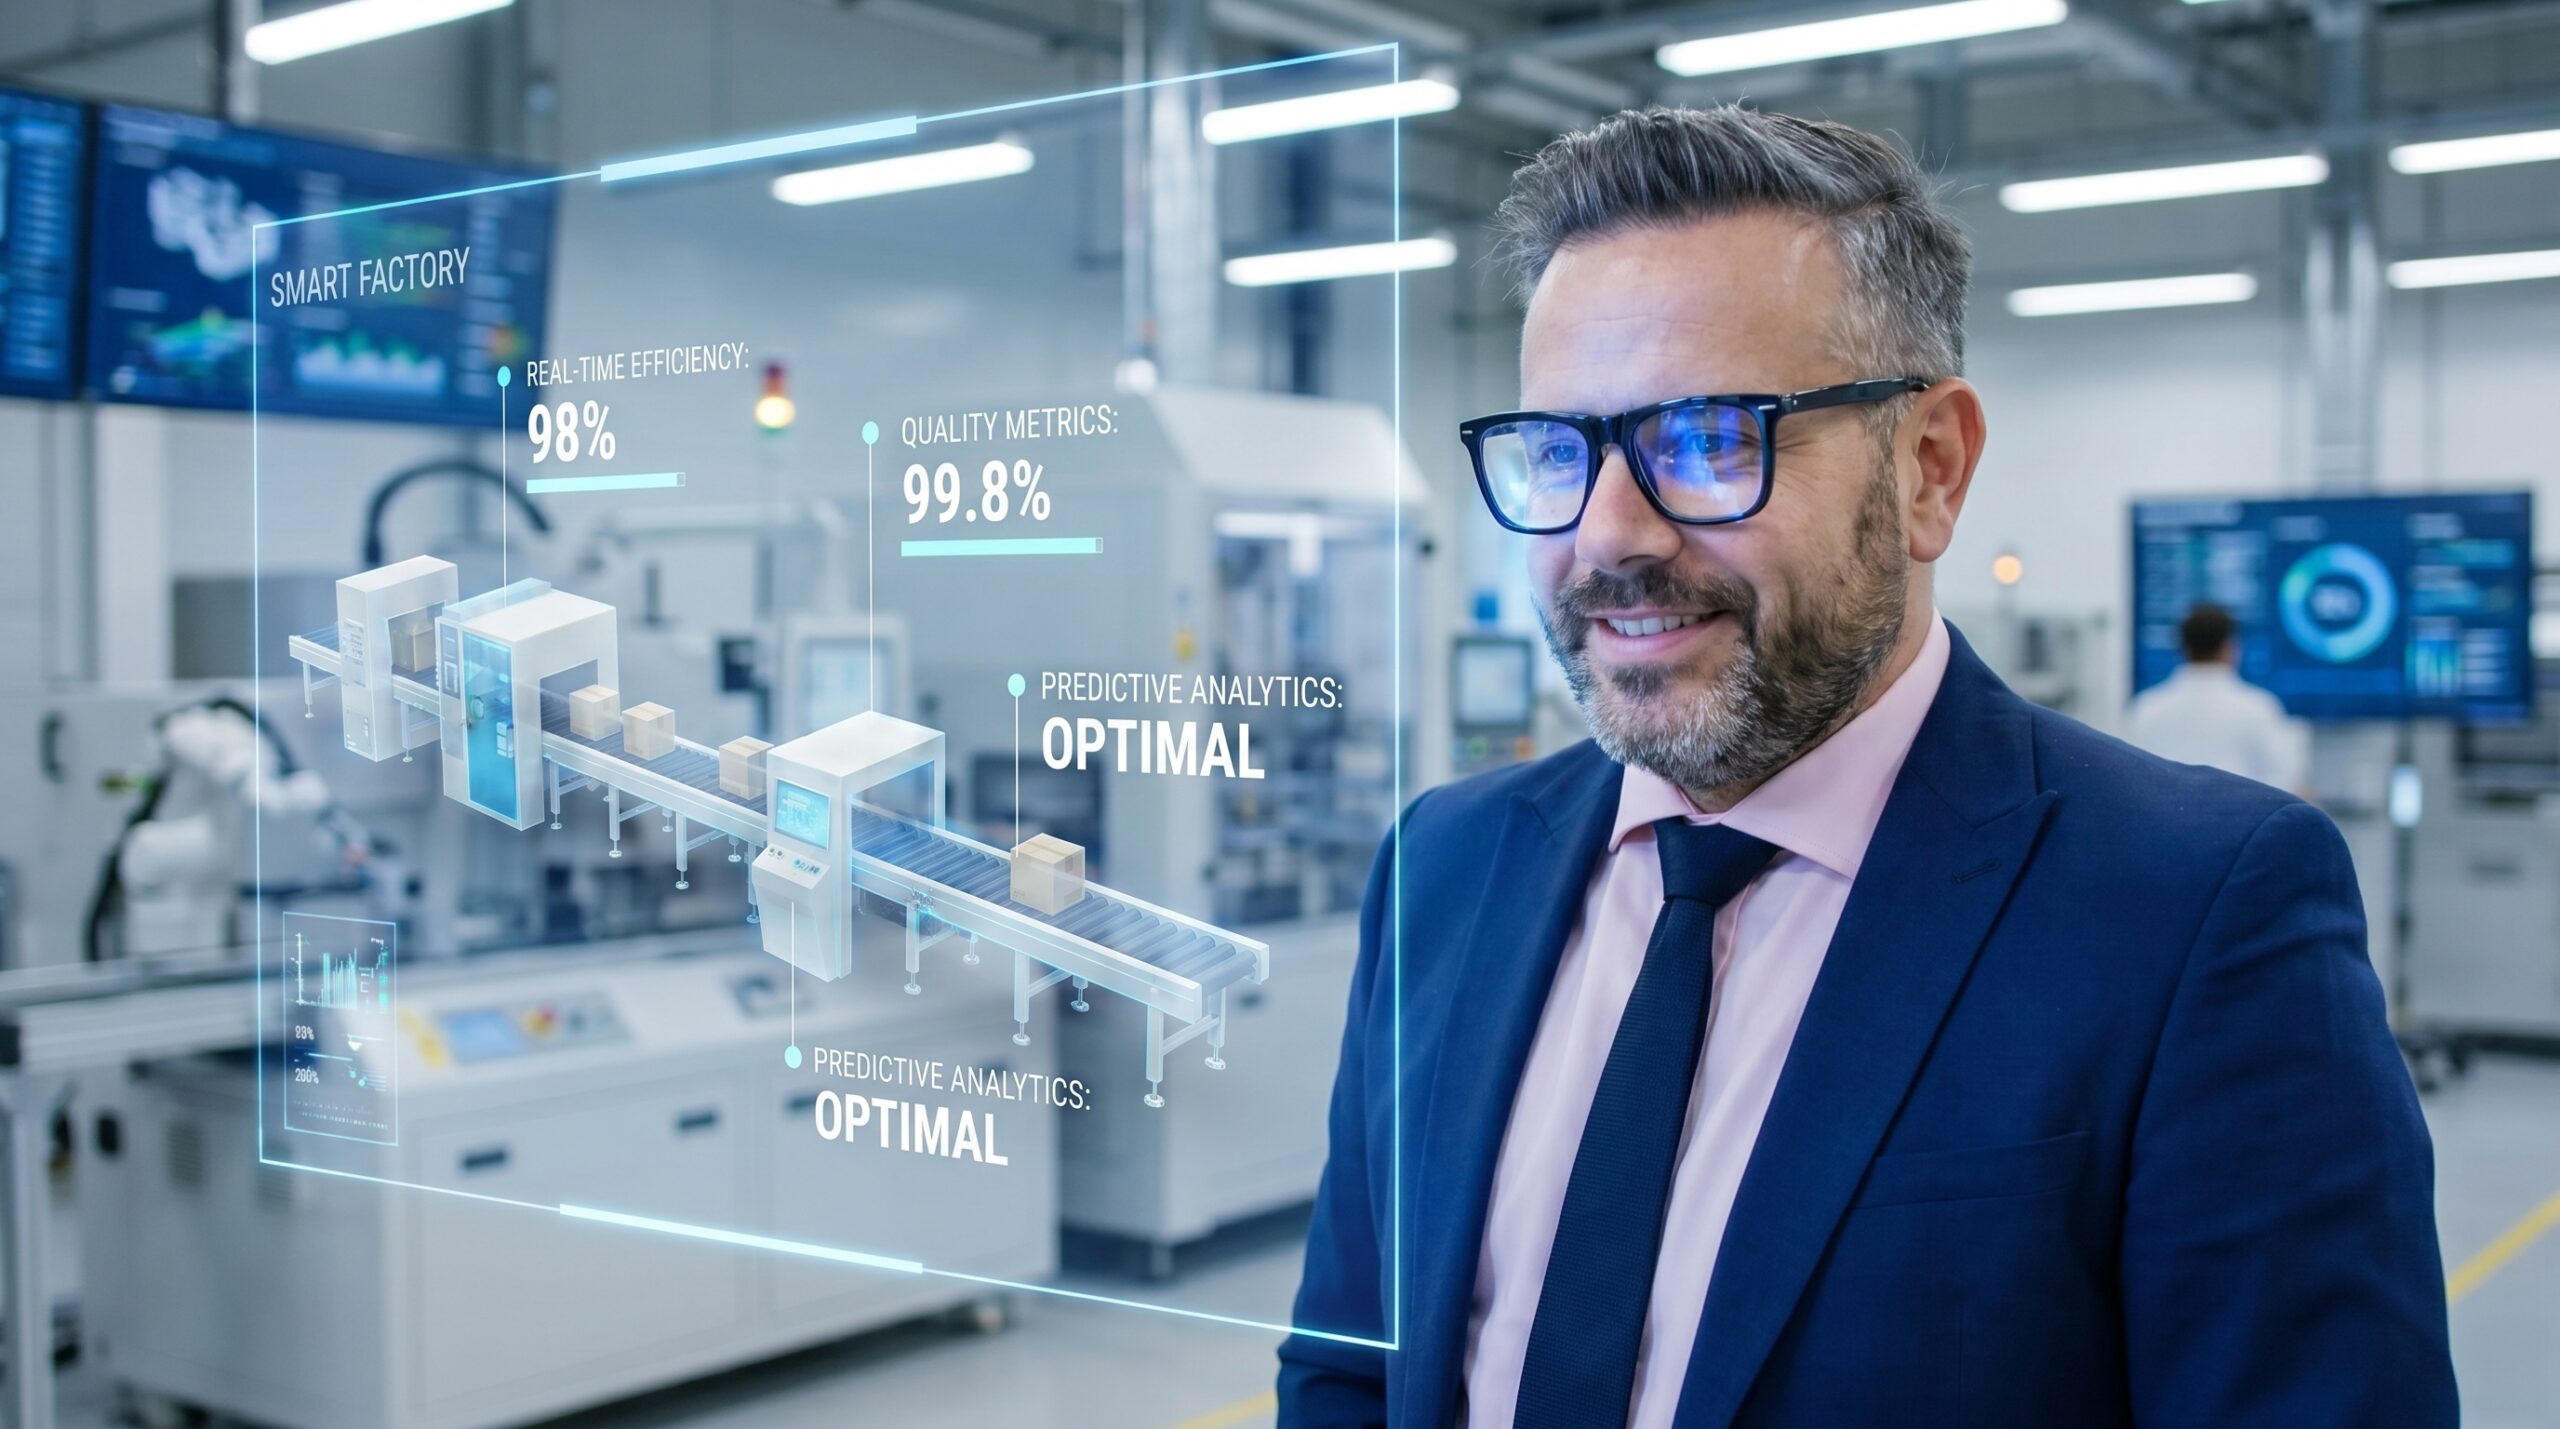
Wednesday morning, 06:47. Before the operator even hits the start button, a notification triggers from the digital twin: predicted temperature deviation in Zone 3 in 43 minutes. Recommended action: reduce heating parameter by 2.3°C. Nothing has failed yet. The scrap has not been produced. But the model has already analysed the trajectory and provided a specific intervention.
This is the operational reality of a functional digital twin in quality engineering. We are moving from a reactive posture — investigating nonconformances after they fail final inspection — to a predictive one. I have implemented ISO 9001 and IATF 16949 systems across automotive and aerospace plants, and the shift from sorting defective parts to preventing them is the single largest leap a quality organisation can make.
A digital twin is not a 3D visualization exercise or a consulting buzzword. It is a mathematical representation of a physical process, continuously updated with real-time IoT data, that predicts future states. It allows quality engineers to simulate variables, validate parameters, and eliminate root causes before they generate a single defective unit. The technology is mature, the implementation costs have dropped, and the ROI is measurable.
The Three-Layer Architecture of a Functional Digital Twin
I first observed a functional digital twin in a German automotive plant running body-in-white welding. The line consisted of 47 robots across 12 stations. On the HMI beside the line ran a 3D model synchronized perfectly with the physical equipment. Every clamp, robot, and weld gun moved in real time.
The real value, however, emerged two weeks later. The system flagged a specific weld point, C-47, predicting electrode degradation after 380 cycles based on current-drop trends. It automatically scheduled a replacement at cycle 300. This was not a guess. It was the output of a statistical model that had analysed thousands of cycles and learned the correlation between parameter drift and weld quality.
This functionality relies on three integrated layers. Without any one of them, the system collapses into an expensive dashboard. The architecture must be built deliberately, starting from the physical machine and ending in automated feedback loops.
Digital Twin Data Architecture
- 011. Physical & Sensor LayerMachines equipped with PLCs and IoT sensors capture real-time variables: torque, temperature, pressure, vibration.
- 022. Data IngestionData streams through IoT gateways to an edge server or cloud environment via protocols like MQTT or OPC UA.
- 033. Virtual ModelAlgorithms process live data against historical baselines and physics-based simulations (FEA, CFD).
- 044. Prediction & ActionThe twin flags deviations and feeds optimised parameters back to the PLC for closed-loop control.
Predictive Quality and Process Optimisation
Traditional quality control relies on detection — SPC charts, final inspection, and 8D reports. Predictive quality, driven by a digital twin, calculates the probability of a defect before the part is manufactured. The model evaluates real-time inputs against historical failure modes and intervenes.
Consider an injection moulding process. The twin analyses melt temperature, injection pressure, mould speed, and coolant temperature. Based on these combined inputs, it predicts the dimensional accuracy of the finished part to within ±0.02 mm — before the mould even opens. If the predicted dimension approaches the tolerance limit, the system recommends a precise parameter adjustment, such as increasing hold pressure by 3.5 bar.
Digital twins also eliminate the guesswork from process changes and what-if scenarios. If you want to increase takt time by 15%, the model will immediately identify which stations will become bottlenecks and how the quality safety margin will degrade. I once used a twin to simulate an adhesive supplier change. The model showed the new adhesive met specification, but at ambient temperatures above 38°C, bond strength dropped by 12%. Without the simulation, we would have discovered this through customer field returns in the summer.
Accelerating Root Cause Analysis and Commissioning
When a nonconformance occurs, traditional Root Cause Analysis (RCA) is retrospective. You audit the paper trail, interview operators, and attempt to recreate the failure conditions. A digital twin allows you to rewind time. You can isolate the exact state of the line when the defect occurred, viewing the precise machine parameters, material batch data, and environmental conditions simultaneously.
In one project involving sporadic brittle fractures in forged parts, the digital twin revealed a hidden three-factor interaction. The failures occurred only when a specific steel batch from Supplier B was processed at a furnace temperature above 1182°C with a hold time under 45 minutes. The statistical probability of this combination was 0.3%, making it appear entirely random on a standard control chart. The model exposed the interaction in hours, not weeks.
The same logic applies to bringing new lines online. Virtual commissioning allows you to debug and optimise a process in a simulated environment. You test edge cases, validate PFMEA risk controls, and tune parameters before the first physical machine is bolted to the floor. This drastically reduces startup scrap and compresses the time required to reach full OEE.
Implementation Failure Modes
If your input data is inaccurate, your digital twin becomes a very expensive generator of fake confidence.
Not every digital twin implementation succeeds, and failure almost always traces back to the same root causes. The most common culprit is poor data integrity. A machine learning model is only as good as the data it trains on. If your PLC data is noisy, your sensor calibration is overdue, or your data gaps are filled with assumptions, the twin will output precise but entirely wrong predictions. Before building any models, invest heavily in data validation and governance.
The second failure mode is over-modelling. I have reviewed projects where quality engineers attempted to map every single sensor and variable into the initial build. The result was a bloated, uncalibratable system that no one understood. The model produced unreliable outputs because the team lost sight of the actual critical-to-quality (CTQ) characteristics. Start with the vital few parameters that drive Cpk, prove the concept, and scale iteratively.
Implementation Approaches
What teams do
- Attempt to model the entire production line at once
- Wait months for a perfect, complete dataset before starting
- View the twin as an IT project disconnected from the floor
- Hide the model's logic inside a black box
What works
- Isolate one critical machine generating the most scrap
- Leverage existing SCADA and MES data streams immediately
- Integrate operators and quality engineers from day one
- Start with a 70% accurate statistical model and iterate
Measuring the Return on Investment
If the technology does not generate a measurable return within 18 months, the implementation is flawed. The financial impact of a digital twin is tracked through specific, undeniable metrics. Unplanned downtime in automotive stamping and assembly routinely costs between €5,000 and €15,000 per hour. A twin that enables predictive maintenance cuts these unplanned stoppages by 30 to 50%.
Predictive quality directly reduces scrap and rework. In an aluminium casting facility, a functional twin optimising process parameters yielded a 20% reduction in porosity defects, translating to €1.2 million in annual savings. Virtual commissioning cuts the time required to launch a new line by 40 to 60%, significantly reducing the labor and scrap costs associated with traditional startup phases.
Typical Digital Twin Impact
The Pragmatic 90-Day Pilot
Do not attempt to build a digital twin for your entire supply chain. Start with a 90-day pilot on one critical process — ideally an operation that currently struggles with high scrap, unpredictable variability, or customer PPMs. The goal of the pilot is not perfection; it is to prove that a mathematical model can predict a quality outcome better than human reaction alone.
Month one is diagnosis. Map every available data source — PLCs, SCADA, MES, ERP — and extract six months of historical data. Identify the dominant failure mode. In month two, build the first model. Use existing tools like regression analysis, random forests, or finite element analysis. Train the model on your historical data, validate it against a separate dataset, and establish the real-time data feed.
Month three is the parallel run. Let the twin run alongside the physical process without controlling it. Compare its predictions against actual measured outcomes. Engage the operators and shift leaders. If the model accurately predicts deviations and recommends effective corrective actions, you have a business case. If it fails, you have learned exactly where your data integrity or process knowledge gaps lie.