
I once sat in a management review where the CFO dropped a stack of nonconformance reports on the table. Scrap for the previous quarter had exceeded a standard industrial threshold for their volume. Twelve people sat in silence. Everyone knew scrap was a problem, but no one knew the total cost of maintaining quality, or what specific failures were actually consuming the margin.
I asked a simple question: How much do you pay to achieve quality, and how much do you pay because you failed to achieve it? The plant manager deflected, insisting that scrap is simply a normal cost of manufacturing. At that exact moment, it was clear the plant did not need another inspector or a new software system. They needed to see their total Cost of Quality, or COQ.
COQ is not merely the cost of what failed. It encompasses every euro an organisation spends to achieve, maintain, and guarantee quality, plus the money lost when it fails. Until you measure all of it, you are managing quality blind, throwing resources at visible symptoms while the actual disease runs unchecked.
The PAF Model: The Complete Financial Picture
Think of quality costs as an iceberg. Above the waterline, you see scrap, customer complaints, and rework. That is typically 10 percent of the actual financial impact. Below the surface hide incoming inspections, internal audits, calibration, preventive maintenance, engineering hours spent on root cause analysis, and expedited freight. Most companies have never totalled these into a single figure.
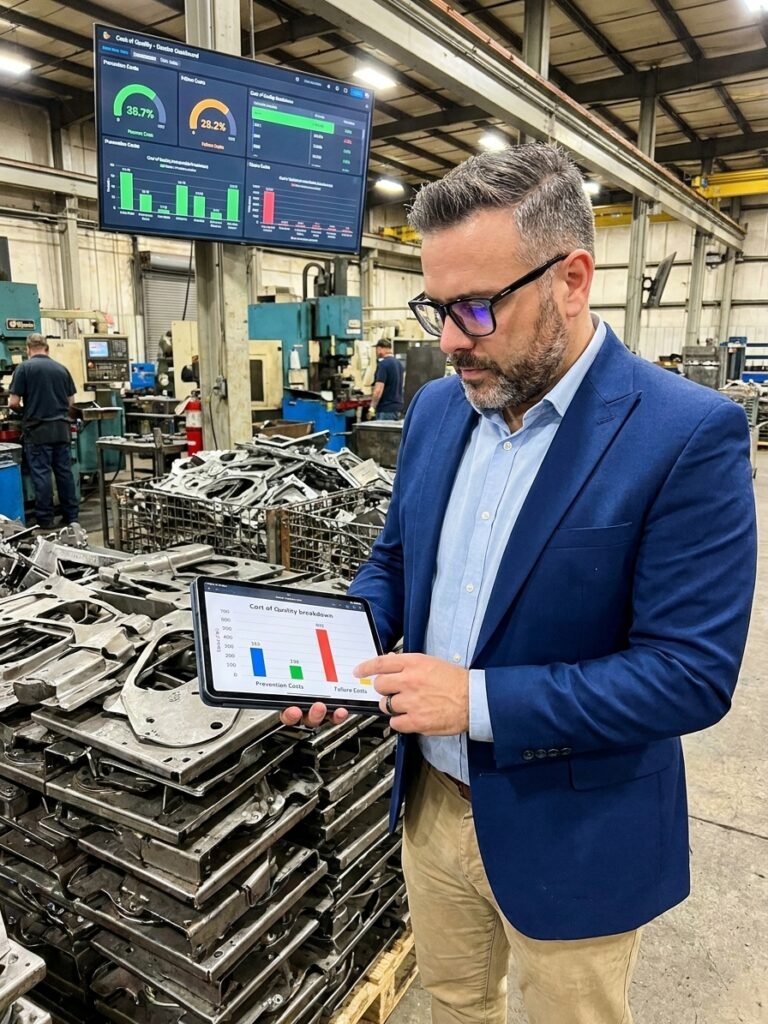
The mechanism used to capture these costs systematically is the PAF model: Prevention, Appraisal, and Failure. These three categories form the complete picture of your quality expenditure. Prevention covers activities designed to stop nonconformities before they happen. Appraisal covers measurement and verification. Failure covers the cost of things that went wrong.
Without this framework, finance treats quality strictly as a departmental overhead, disconnected from operational strategy. By mapping every quality-related activity into one of these three buckets, you expose the true financial leverage points and shift the conversation from subjective opinions to objective resource allocation.
Prevention: The Highest-Return Investment
Prevention costs are the inputs required to keep defects from occurring in the first place. This includes quality planning, Design and Process FMEA (DFMEA and PFMEA), operator training, supplier auditing, equipment maintenance, and the implementation of Poka-Yoke or error-proofing devices.
I have audited plants where the vast majority of customer complaints originated from a single welding operation. Instead of adding inspection headcount at the end of the line, we invested in real-time parameter monitoring and trained operators to detect process drift. Within months, complaints from that operation dropped drastically. The investment in prevention paid for itself many times over.
The governing principle is simple arithmetic: every euro invested in targeted prevention saves a multiple of that amount in failure costs downstream. This is not a philosophical statement about continuous improvement; it is a predictable financial return documented across the automotive and aerospace sectors under IATF 16949 and AS9100 requirements.
Mature vs Immature COQ Distribution
Unmeasured COQ Profile
- Failure accounts for 50-70% of total cost
- Prevention is underfunded at 5-10%
- High scrap, rework, and warranty claims
- Inspections added reactively to catch defects
Optimised COQ Profile
- Prevention funded at 20-30% of total cost
- External failure driven below 5%
- Total COQ drops by 30-50%
- SPC replaces manual final sorting
Appraisal: The Cost of Verification
Appraisal costs cover everything required to verify that products or processes meet specifications. This includes incoming, in-process, and final inspections, laboratory testing, gauge calibration, internal audits, and Statistical Process Control (SPC). Appraisal is the price of proving quality exists.
The trap with appraisal is over-inspecting stable processes. I once tracked how much time inspectors spent checking parts from a historically stable CNC cell. Over 70 percent of the inspected parts had never exhibited a defect. We relocated those inspection hours to high-variability operations, implemented SPC based on the Control Plan, and saw overall inspection costs drop while escape rates declined.
When you inspect operations that do not have problems, you waste money and leave high-risk processes unmonitored. Effective appraisal requires aligning your inspection resources where process data indicates actual variability, rather than applying blanket checks across the entire bill of materials.
Internal and External Failure
Failure is the most expensive category, split into internal and external costs. Internal failure covers defects caught before shipment: scrap, rework, line downtime, failure analysis, and downgrading. External failure covers defects caught by the customer or end-user, including warranty claims, returns, expedited freight, and penalties.
External failure is where the numbers become catastrophic. I have seen a supplier ship a batch of defective seals to a major OEM. The defect was caught at the assembly line. The complaint process, express replacement delivery, and delivery delay penalties were severe, but the real cost was losing the next model year contract, wiping millions from their annual revenue.
When you inspect operations that do not have problems, you leave high-risk processes unmonitored and waste critical resources.
A defect that costs a few cents to prevent at the source can cost euros to catch internally, and hundreds of euros if it escapes to the customer. The escalation factor between internal and external failure is why proactive process control is the only mathematically viable strategy for maintaining margin in regulated industries.
Implementing COQ Reporting
You do not need a new IT system to start measuring COQ. You need to connect existing data sources. Scrap is already in your ERP. Complaints are logged in your 8D system. Training hours sit in HR. Calibration records are in metrology. The first step is defining your specific cost categories using the PAF model and pulling the baseline data.
Start with estimation using existing records rather than waiting for a perfect, real-time reporting tool. Perfectionism is the enemy of the first step. Calculate these costs as a percentage of revenue. That is the metric that bridges the gap between the quality department and the finance department, ensuring leadership understands the financial impact.
In un optimised organisations, total COQ frequently reaches 10 to 20 percent of revenue. The industrial benchmark for mature, systematic operations is 2 to 4 percent. That gap represents pure margin sitting on the table, waiting to be recovered by shifting resources from reactive firefighting to proactive process control.
Industry COQ Benchmarks
Avoiding Common Reporting Traps
The most common trap is omitting hidden costs. You easily see physical scrap in the ERP, but you must capture the engineering hours spent writing 8D reports instead of improving PFMEAs. You must count the operators who visually inspect parts three times because they do not trust the upstream process capability.
Second, do not treat COQ as a static number. It is a trend. If your total COQ drops, but prevention spending also drops while failure costs rise, you are on the wrong trajectory. Declining COQ without an increasing prevention baseline is a warning sign, not a victory.
Finally, never use COQ data to punish departments. If managers fear that high failure costs will be held against them, they will manipulate the reporting. COQ is a diagnostic tool for system improvement, not a stick for individual performance reviews. A culture that punishes failure breeds hidden defects.
When you finally expose the total cost of quality, the path forward becomes obvious. In that initial plant management review, the first COQ report revealed quality costs at 14.2 percent of revenue. By shifting appraisal resources into SPC, funding targeted operator training, and implementing basic error-proofing, total COQ dropped below 8 percent within a year, recovering over a million euros in margin.
Quality is not a cost centre. Poor quality is a cost. Good quality, driven by funded prevention and statistical process control, is an investment with a measurable return.