A dimensional deviation on a critical engine bore shuts down the assembly line. Four consecutive shifts produce the same defect. The Tier 1 customer threatens to halt deliveries entirely. Under this pressure, most quality engineers open PowerPoint. They build twenty slides of colourful charts and 3D pie diagrams, ultimately delivering no clear root cause and scheduling another meeting.
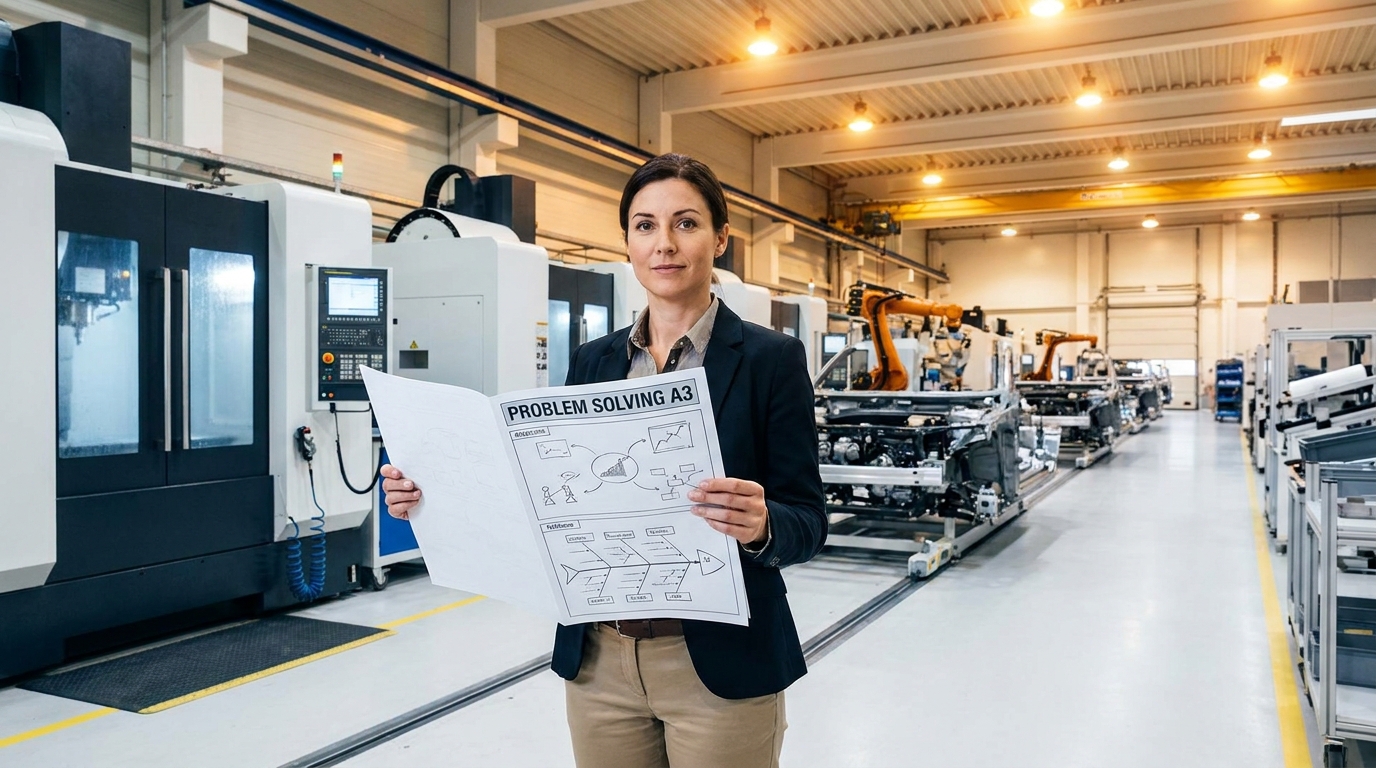
The alternative is the A3 methodology, developed within the Toyota Production System. The engineer sits down with a single sheet of A3 paper (420 × 297 mm) and constructs a logical, complete story of the problem. Within an hour, they know exactly what is happening, why it is happening, and what countermeasures to deploy.
The constraint of the format is the source of its power. When you must fit the entire narrative onto one page, you cannot hide behind data volume. You are forced to separate the vital few factors from the trivial many. Throughout my career implementing IATF 16949 systems, I have consistently found that the discipline of writing a concise A3 exposes gaps in understanding that a fifty-page failure investigation simply masks.
The A3 Structure: Context Before Data
An A3 is not a blank canvas. It is a highly structured sequence divided into specific phases: Background, Current Condition, Target, Analysis, Countermeasures, Confirmation, and Standardisation. Each section forces a specific type of thinking. Skipping a phase breaks the logical chain.
The Background phase establishes the business context. You state who the customer is, what the product is, and what is at stake. You do not start with scattered numbers. You start with the operational reality: "Manufacturing engine blocks for an aerospace customer. Volume: 1,500 units/month. Tolerance on the pin bore: ±0.02 mm. Last four shifts: 12 percent out of tolerance. Standard: <0.5 percent."
This framing tells the audience exactly what matters in three sentences. It eliminates diplomatic padding and focuses leadership's attention immediately. The narrative sets the baseline before any deep statistical analysis begins.

Current Condition and Going to the Gemba
The Current Condition phase requires depicting the process exactly as it exists today, not as it was designed in the PFMEA. You must physically go to the gemba—the shop floor where the work happens. Nothing is written from memory or assumed from a desk. You observe, measure, and map the actual flow.
Draw the process flow and pinpoint where the defect emerges. Note the measurement intervals. For instance, the CMM measures the critical bore every batch of 50 pieces, but the dimension progressively drifts out of tolerance between checks. You map this degradation visually on the A3.
The cardinal rule here is strict documentation without interpretation. You do not guess causes yet; you simply display the facts of the current state. If the filtration system is clogged with chips, you photograph it and note the machine parameters. You build an unarguable picture of reality.
Driving to the True Root Cause
Most organisations fail at root cause analysis because they stop too early. When a drill breaks prematurely, they write "operator error" or "worn tooling" and close the 8D report. This is an excuse, not a root cause. The Analysis phase demands you push deeper until you find the system failure.
Use the 5 Whys technique iteratively. If the tooling wore out after 800 pieces instead of the planned 2,000, ask why. If the cutting fluid was insufficient, ask why. If the nozzle is clogging with chips, ask why. The answer should lead you to a system-level deficiency, such as the filtration unit being sized for a different material grade.
When you identify that the coolant filtration system is fundamentally inadequate for the current 42CrMo4 alloy, you have a systemic root cause. This shifts the focus from blaming human behaviour to engineering a robust process. Solving systemic issues prevents the exact same defect from recurring next month on a different shift.
If your root cause is 'operator error,' you have stopped asking questions prematurely.
Deploying Targeted Countermeasures
The Countermeasures phase requires specific actions, assigned owners, and strict deadlines. You do not write "improve filtration." You write: "Replace the emulsion filtration system with the XYZ-500 model. Responsible: Maintenance Manager. Deadline: 14 days." Vague language breeds vague execution.
Toyota makes a critical distinction here between a permanent solution and a countermeasure. A countermeasure is what you deploy immediately to stop the bleeding. If the filtration system takes 14 days to install, your interim countermeasure is implementing a mandatory 2-hour nozzle cleaning checklist for the operator.
You also update the control plan and shift the tool change interval to 800 pieces temporarily. These overlapping countermeasures ensure that quality is maintained while the permanent engineering fix is being procured and installed. Every action must be verifiable on the shop floor.
The 7-Step A3 Problem-Solving Flow
- 011. BackgroundEstablish the operational and business context of the defect.
- 022. Current ConditionMap the process exactly as it exists on the shop floor today.
- 033. TargetDefine specific, measurable quality goals with strict timelines.
- 044. AnalysisDrive deep into systemic root causes using 5 Whys and Ishikawa.
- 055. CountermeasuresAssign specific, interim and permanent actions with deadlines.
- 066. ConfirmationVerify the data proves the countermeasures actually worked.
- 077. StandardiseUpdate PFMEA, control plans, and deploy yokoten to other lines.
Confirmation and Horizontal Deployment
The Confirmation phase defines exactly how success will be measured. "It looks better" is not a confirmation. You must set specific data checks: "Review the CMM data for OP30 at 7, 14, and 30 days. Target: <0.3 percent out of tolerance." Crucially, you must also define the escalation trigger if the fix fails.
If the defect rate remains above 1 percent after 14 days, the issue must be automatically escalated to plant management for further resource allocation. Anticipating failure is a mark of professional quality engineering, not pessimism. It prevents complacency and ensures sustained oversight.
Finally, Standardisation locks in the gains. If the new filtration system works on line one, that information must be shared across the entire manufacturing network. Updating the PM (Preventative Maintenance) schedule and deploying yokoten—sharing lessons learned—ensures the plant in a different region does not repeat the same engineering mistake.
Traditional Reporting vs A3 Discipline
What teams typically do
- Build 20-slide PowerPoint decks with decorative charts.
- List broad findings without clear causal links.
- Blame generic operator error instead of engineering systems.
- Present findings as a one-way monologue in a meeting.
What A3 methodology achieves
- Forces conciseness by constraining the story to one page.
- Builds a logical chain from context through to root cause.
- Identifies systemic failures and assigns specific countermeasures.
- Acts as a living document refined through mentor dialogue.
Building Organisational Maturity Through Dialogue
An A3 is not an isolated form; it is the physical medium for a dialogue known as nemawashi—the process of building consensus through thorough preparation. The first draft is never final. The author presents the A3 to a mentor or senior engineer who rigorously challenges every assumption.
The mentor asks: "Were you on the shop floor? Did you verify the CMM calibration? How do you know the fluid pressure is the true constraint?" The author returns to the process, gathers missing facts, and refines the narrative. This iterative refinement continues until the logic is bulletproof.
Organisations go through three distinct stages of A3 maturity. At Level 1, people treat it as a mandatory form and fill in boxes without genuine analysis. At Level 2, teams grasp the engineering logic and deploy tools like 5 Whys effectively. At Level 3, A3 becomes a fundamental way of thinking.
When an organisation reaches Level 3 maturity, engineers automatically structure their thoughts logically—even without a blank A3 template in front of them. When asked about a quality issue, they immediately provide the context, current state, root cause, and proposed countermeasures in a concise, structured flow. This is the ultimate goal.