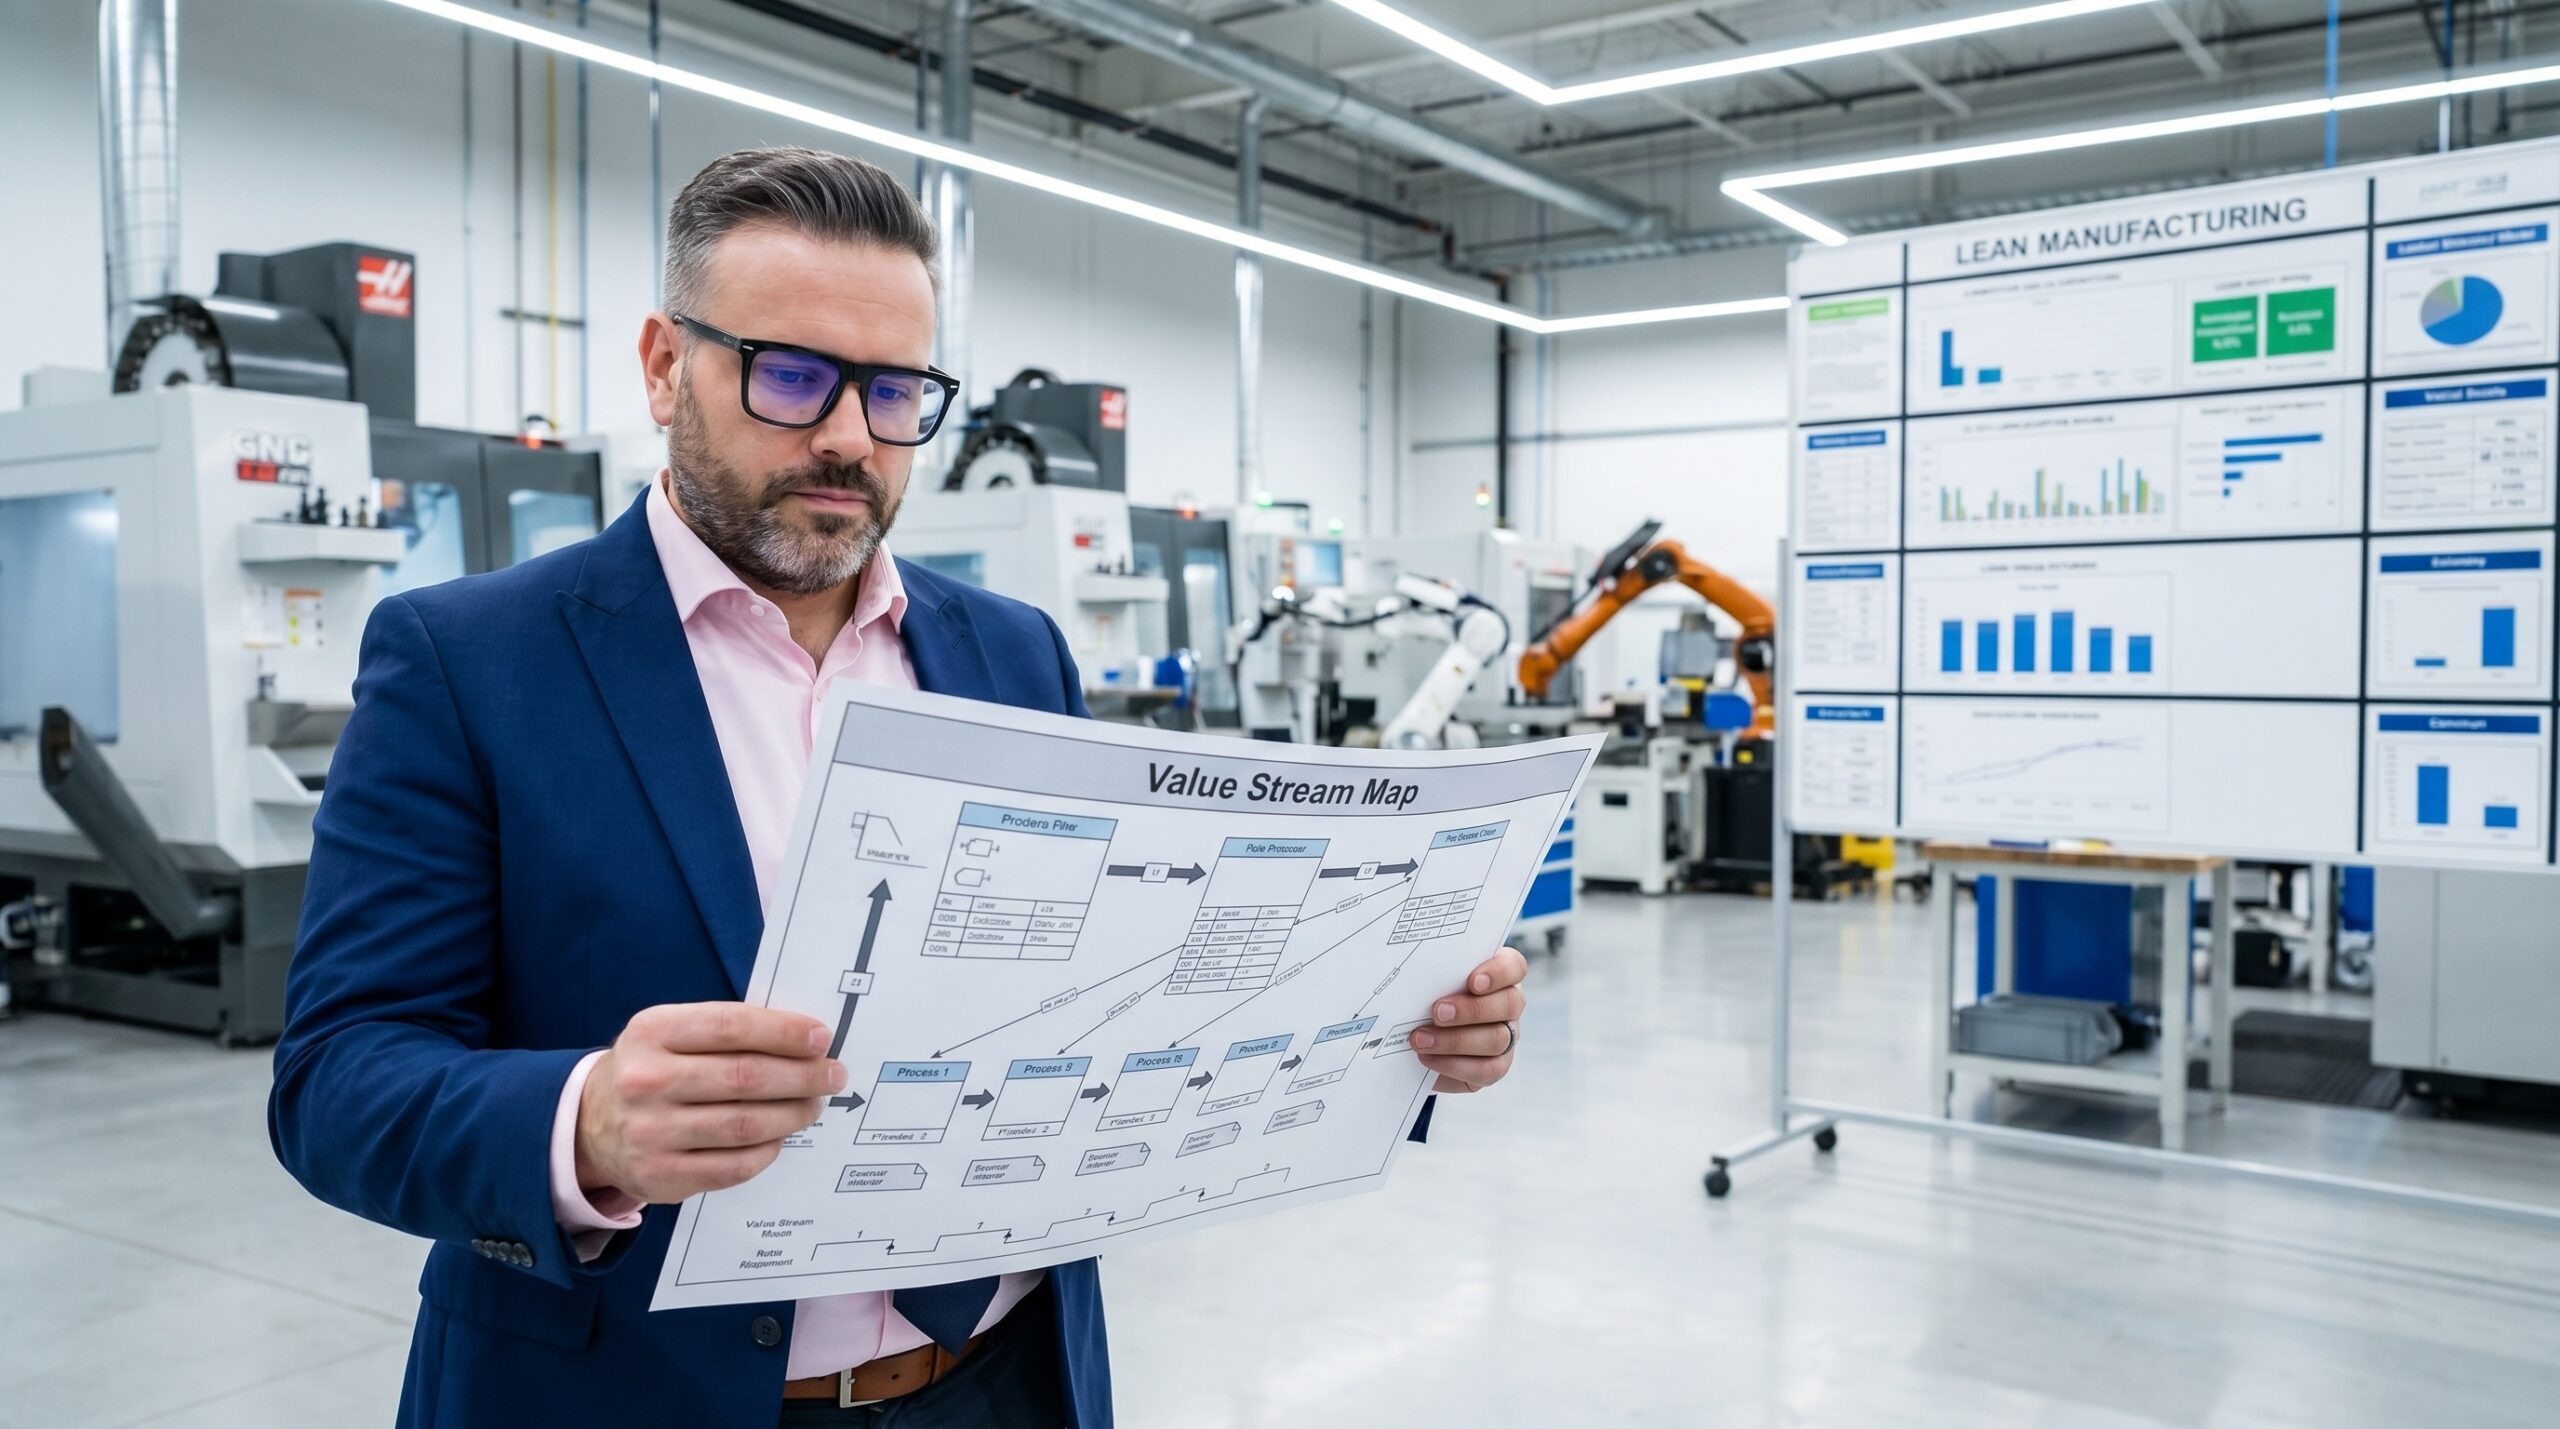
I walked into a CNC machining plant in Eastern Slovakia that produced precision metal parts for the automotive sector. The facility looked immaculate. Clean floors, modern robotics, and a newly installed milling machine holding a 0.005 mm tolerance. The production manager was justifiably proud of his scrap rate, which sat below one percent.
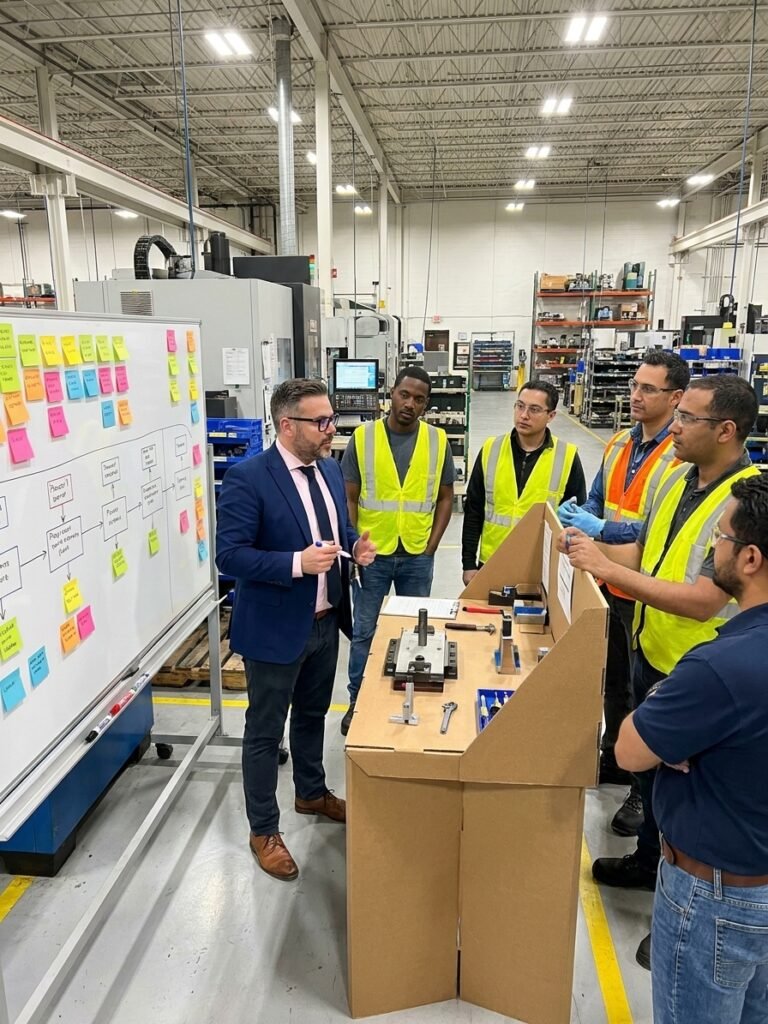
I asked to see the flow, not the machines. We sat down with a cross-functional team—production, engineering, quality, logistics, and a line operator—and drew a Value Stream Map (VSM) on a single A3 sheet. What that paper revealed fundamentally shifted the management's understanding of their own factory floor.
The quality of the individual machines was never the problem. The problem was the systemic friction between them. When you isolate operations, you optimise locally. VSM forces you to confront the reality of the entire system, exposing the hidden costs of your internal logistics.
The Mechanics of Value Stream Mapping
VSM is a visualisation tool that captures the complete flow of material and information from supplier to customer. It is not a high-level process flowchart. It is a radiograph of your production line, exposing not just what is happening, but what is stagnating.
The methodology formalised by Mike Rother and John Shook in 'Learning to See' roots back to the Toyota Production System. The premise is rigorous: every activity in a manufacturing process falls into one of three categories. Categorising them objectively is the first step toward systemic improvement.
Value-added activities are those the customer pays for—machining, welding, assembly. Necessary non-value-added activities do not add value but are currently required for operational or regulatory compliance, such as in-process inspection or packaging. Pure waste is everything else: waiting, rework, searching for missing components.
VSM maps these categories visually. It forces you to measure the time material spends in each state. The exercise immediately highlights how much capital you tie up in processes that add absolutely no value.
Mapping the Current State
To map the current state, we started at the customer. They took 12,000 parts monthly in weekly shipments of 2,000. We walked the shop floor and mapped every processing step: raw material cutting, roughing, finishing, external heat treatment, grinding, final inspection, and shipping.
Under every process box we recorded three operational metrics: Cycle Time (CT) for processing one piece, Changeover Time (C/O) for machine setups, and Uptime percentage. Then we drew the timeline at the bottom of the map to calculate total Lead Time—the duration from raw material entry to the shipping dock.
The aggregate process time—actual value-added and necessary work—was 4 minutes and 32 seconds per part. The total lead time was 23 days. That part spent over three weeks in the facility, but actual work was applied for less than five minutes.
This means 99.986 percent of the cycle was spent moving, sitting in queues, or resting in warehouses. At a unit cost of €3.20, that 23-day lead time trapped approximately €180,000 in Work-In-Process (WIP) inventory every single month.
The Information Flow Disconnect
VSM also maps how information triggers production. In this plant, we traced the order from the customer, through sales, to production planning, and down to the floor. We discovered that information moved slower than the material itself.
The planning department ran on a strict weekly cycle. If a customer modified an order on Tuesday, the change did not reach production until the following Monday. The factory spent a week building to an obsolete schedule, generating unneeded inventory that consumed cash and crowded the shop floor.
This disconnect between information speed and material speed is the primary driver of excess inventory. High inventory levels are dangerous because they directly mask quality defects. When you hold 3,000 units in a queue, a defect goes unnoticed for days. When you hold 50, every defect triggers an immediate containment action.
This is the core diagnostic value of VSM. It demonstrates that large inventory buffers are never a sign of healthy capacity. They are a compensating mechanism for broken logistics and misaligned information flows.
Current State vs. Target Flow Metrics
Designing the Future State
With the current state quantified, we designed the Future State Map. We relied on three structural questions to guide the redesign. These questions determine where material flows continuously, where it must be pulled, and what sets the rhythm of the entire facility.
First, we identified where continuous flow was possible. Rough and finish machining were physically close, but separated by a WIP buffer. By applying SMED (Single-Minute Exchange of Die) principles, we reduced the 45-minute changeover to 12 minutes. This eliminated the need for batch production between those two specific steps.
Second, we implemented a pull system where continuous flow was impossible. External heat treatment took five days at a supplier facility. We built a controlled supermarket with Kanban triggers. When finished goods inventory dropped to a defined minimum, a Kanban card triggered a new batch for heat treatment.
Finally, we established the pacemaker process. We placed it immediately after heat treatment, right before grinding. This single point dictated the production rhythm for all upstream processes, ensuring material flowed without interruption straight to the customer from that point onward.
VSM Future State Implementation Sequence
- 01Define Product FamilySelect products sharing similar routing to scope the mapping effort.
- 02Walk the GembaRecord actual cycle times and WIP levels directly at the machine.
- 03Draft Current StateMap material and information flows to expose total lead time.
- 04Engineer Future StateIdentify continuous flow, pull systems, and the pacemaker process.
- 05Execute KaizenImplement structural changes targeting the largest bottlenecks first.
Operational Results and Quality Integration
Implementation required altering production schedules, physically relocating machinery, and renegotiating logistics with the heat treatment supplier. Within 90 days, the structural changes yielded measurable results across the facility's primary KPIs.
Lead time dropped from 23 days to 8 days. WIP inventory fell from €180,000 to €65,000, freeing up 120 square metres of production floor. The defect rate halved from 0.8 percent to 0.4 percent because smaller batches exposed nonconformities instantly, rather than hiding them in massive queues.
The most significant change was cultural. Operators began to understand downstream impact. A delay at the cutting station was no longer an isolated event; it was recognised as a disruption that starved the grinding cell three shifts later.
Excess inventory is not a buffer against demand; it is a compensating mechanism for poor process control.
Every piece sitting in a queue is a piece that can be damaged, mixed with another part number, or rendered obsolete by an engineering change. Unnecessary handling generates dents, scratches, and dimensional drift. Every day added to lead time is a day the customer waits.
VSM is categorised as a lean tool, but it is fundamentally a quality engineering instrument. When material flows without stopping, defects are immediately visible against the succeeding operation. Toyota understood this in the 1950s. The highest quality is built in smooth flow, not accumulated in stagnant piles.
Common Failure Modes in VSM
I have audited numerous plants where VSM initiatives failed to deliver results. The failure is rarely due to a flawed map. It is almost always the result of specific, predictable implementation errors that undermine the methodology.
The most common failure is the map without action. A team spends three days drawing an accurate diagram, frames it on a wall, and never assigns implementation targets. A VSM without a structured Kaizen execution plan is a theoretical exercise, not a manufacturing tool.
Another frequent error is drawing the map from the office. A process map built without walking the shop floor is fiction. Standard operating procedures rarely reflect the actual reality of how operators handle material, manage bottlenecks, or compensate for missing components.
Finally, teams often ignore the information flow. Mapping only the physical material hides the structural delays caused by MRP systems, weekly planning cycles, and departmental silos. If you map only half the system, you will never eliminate the true bottleneck.