
When a critical nonconformance breaches your containment and reaches the customer, the immediate crisis is containment. Stock gets quarantined, suspect lots are recalled, and emergency 100-percent inspection sorts good parts from bad. But once the line is stabilised and the immediate fire is extinguished, quality engineers face a harder problem: the quality management system documented that a control existed, the audit trail confirmed it was implemented, and the failure happened anyway.
The standard 8D response—isolating the immediate technical failure and adding a redundant inspection step—rarely exposes why the existing barrier degraded to the point of irrelevance. The corrective action addresses the symptom. It does not map the operational conditions that silently defeated the control structure. Without that map, the organisation fixes one node while the systemic weakness remains latent, waiting for the next shift change or material variance to trigger an identical escape on a parallel line.
Bowtie analysis, originally developed for chemical process safety and now embedded in aviation safety frameworks, offers a structured method for post-failure recovery. Instead of asking whether a control existed on paper during the audit, it forces a cross-functional team to reconstruct exactly how each barrier failed under real manufacturing conditions. The output is not a compliance artefact. It is an operational repair manual for the control structure itself.
Reconstructing the Failure Pathway from Evidence
Post-failure bowtie analysis begins with a forensic commitment: define the top event as the precise, measurable moment control was lost, not the downstream consequence. Teams recovering from an escape frequently offer abstract descriptions—unacceptable supplier quality, defective machined components, poor heat-treatment outcomes. These are outcomes. A functional top event must be something a sensor could detect or an operator could witness in real time.
Unverified nonconforming raw material entering the production flow is an actionable top event. Critical heat-treat furnace temperature dropping below the documented transformation window is an actionable top event. Poor quality is not. The precision of this definition determines whether the subsequent mapping exercise produces diagnostic value or merely reconstructs the quality manual's ideal-state description. Vague definitions generate vague barriers, and vague barriers are the ones that fail silently.
Once the top event is locked down with forensic specificity, the recovery team maps left and right. Threats on the left represent the specific conditions that triggered the breach. Consequences on the right represent the actual business and operational impacts that materialised. Between them sit the barriers—preventive controls on the left designed to stop the threat, and mitigative controls on the right designed to limit severity. The post-failure context gives this mapping its power: the team already knows the barriers failed, so the analysis focuses on exactly how and why.
Tracing a Heat-Treat Fixture Failure Through Degraded Barriers
- 01ThreatThermal shock from interrupted quench cycles exceeds engineered fixture limits.
- 02Preventive barrierQuench tank monitoring system intended to flag cycle interruptions.
- 03Escalation factorSensor calibration drifted after four months of thermal cycling, masking the gradient.
- 04Top eventFixture cracks, compromising the dimensional integrity of the forging.
- 05Mitigative barrierPost-process dimensional check at the machining cell.
- 06Final consequenceNonconforming parts bypass inspection and reach the OEM assembly line.
Consider a supplier producing safety-critical forged brackets who traced a field failure back to a cracked heat-treat fixture. The documented 8D action replaced the tooling and added a visual inspection step. Six months later, a different product family on a parallel line experienced identical cracking. Neither fix had addressed the underlying systemic weaknesses in tooling management, because neither fix had mapped the escalation factors that defeated the original barriers.
Classifying Barriers by Real Enforcement Mechanism
The most uncomfortable finding during a post-failure bowtie workshop is the realisation that standard operating procedures are routinely mistaken for barriers. A procedure instructs an operator to act. A barrier physically prevents the problem or systematically enforces the containment. This distinction is the fulcrum of effective recovery. If a preventive control relies entirely on a line worker remembering to verify a measurement—without a Poka-Yoke device, a forced sequence, or a system interlock—it is not a barrier. It is a professional hope.
Recovery teams must classify every barrier on the diagram by its actual enforcement mechanism, not its documented category. Physical containment, automated machine interlocks, and software-enforced recipe locks represent hard barriers that function regardless of operator state or shift fatigue. Procedural checks, visual inspections, and training matrices represent soft barriers that require constant, active human compliance. Both categories have legitimate value in a defence-in-depth architecture, but a risk pathway secured exclusively by soft barriers is dangerously exposed and must be flagged as such.
When the production rate doubles, when a shift extends past ten hours, or when a new operator joins the cell with limited muscle memory for the process, soft barriers degrade first and fastest. Human vigilance is a valid mitigation layer, but it must never be the sole layer of defence for a critical safety characteristic. The post-failure analysis must identify every node where a soft barrier was the last line of defence and recommend a hard enforcement mechanism as part of the corrective action.
Interrogating Escalation Factors as Failure Mechanisms
Listing barriers is a standard audit exercise. Mapping escalation factors is where genuine post-failure analysis begins. An escalation factor is the specific, realistic operational condition under which a preventive or mitigative barrier fails to perform its intended function. It is the manufacturing reality that defeats the procedural theory. In a recovery context, the escalation factor is usually the thing that actually caused your nonconformance to escape.
Consider a standard preventive barrier in machining: a planned tool replacement schedule designed to prevent catastrophic insert failure. The escalation factor is that abrasive material variance in the incoming bar stock accelerates tool wear beyond the engineered parameters. If the maintenance schedule assumes uniform metallurgical properties across every lot, the barrier fails exactly when the threat it was designed to mitigate spikes. Without mapping that degradation path, the risk register remains dangerously inaccurate and the next lot of abrasive material triggers the same failure mode.
Mitigative barriers on the right wing suffer the same degradation. A final electromagnetic inspection station serves as a mitigative barrier against shipping cracked components. The assumed capability requires certified operators and calibrated eddy current equipment. The escalation factor is that high contract turnover left the station staffed by an operator whose certification expired last quarter. The barrier exists in the HR training matrix, but it has been functionally defeated by workforce attrition. The post-failure team's job is to find this gap before the next escape does.
| QMS Documented State | Bowtie Diagnostic Finding | Recovery Action Required |
|---|---|---|
| Furnace temperature monitored by redundant control loops. | Controller redundancy defeated by shared firmware logic vulnerability. | Segregated backup controller with independent sensor architecture. |
| Hardness verified via destructive testing on a sample size basis. | Destructive sampling statistically misses boundary lots processed during drift. | Increase sample frequency and add real-time inductance monitoring. |
| Operators trained to respond to deviation alarms on the HMI. | Ambient noise on the shop floor masks the primary audible alarm. | Install visual stack lights with automated machine hold interlock. |
| Calibration interval set at twelve months per OEM requirement. | Calibration drift accelerates after four months due to thermal cycling. | Shorten interval to six months and add mid-cycle verification check. |
Running the Recovery Workshop With Diagnostic Discipline
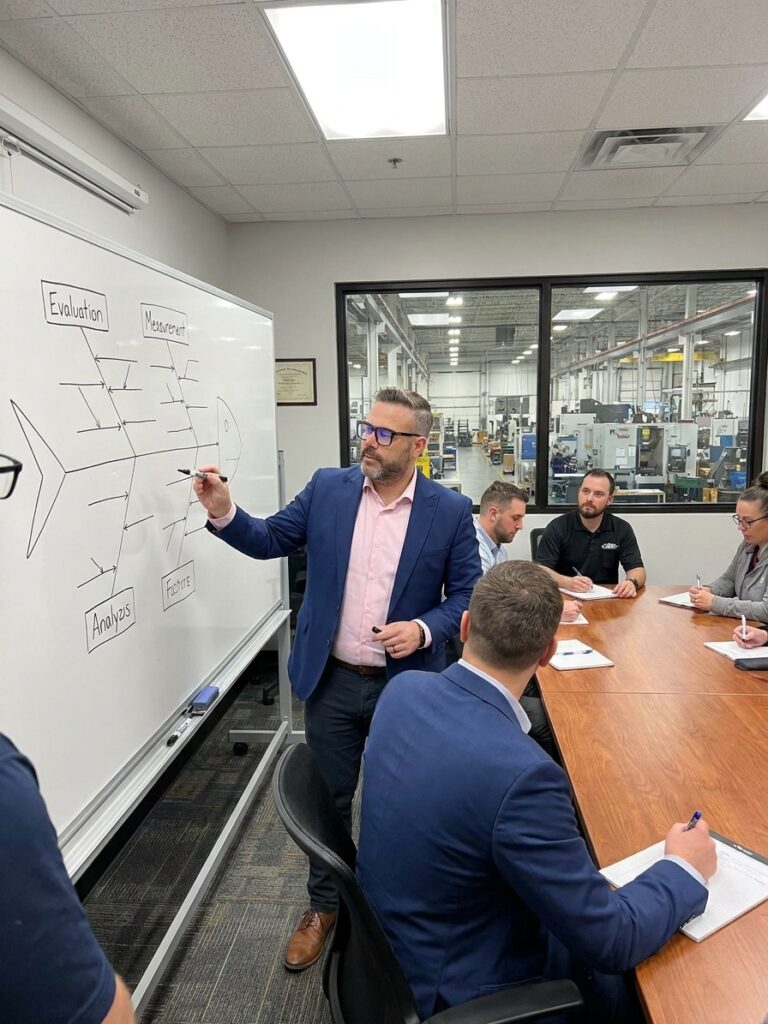
A quality engineer constructing a post-failure diagram alone in an office will inevitably map the documented system, not the operational reality that produced the nonconformance. The methodology demands cross-functional interrogation. Maintenance technicians know which sensors stick and which calibration intervals are routinely stretched under production pressure. Process engineers know which thermal windows drift with ambient humidity changes. Operators know which alarms are routinely ignored because they trigger too frequently. Without these perspectives, the diagram becomes a compliance artefact rather than a diagnostic instrument.
Facilitators must establish a strict diagnostic posture before the workshop begins. If the organisational culture treats the admission of an uncontrolled hazard as a leadership failure, participants will simply redraw the documented procedures and declare the process robust. The workshop must operate under the explicit ground rule that identifying a degraded barrier is a system improvement, not an indictment of the shift supervisor or the process owner. People must feel safe describing the two-o'clock-in-the-morning reality or the analysis is worthless.
Across two decades in automotive and aerospace manufacturing, I have audited plants that executed textbook 8D root cause analyses and still suffered identical nonconformances in different production cells months later. Classic RCA typically isolates the immediate technical failure—replacing a broken sensor, retraining an operator, adding a single inspection point. It rarely exposes the systemic interaction between degraded barriers that allowed the initial failure to escape detection in the first place. The post-failure bowtie workshop exists to close that gap.
If you cannot name the specific condition under which your control fails, you do not know your actual risk exposure.
Sustaining the Repaired Control Structure
A completed post-failure bowtie diagram is a snapshot of a single operational moment. The day after the workshop concludes, production pressure, equipment age, and workforce changes begin eroding the barriers the team just validated and repaired. Treating the completed diagram as a static record for the next ISO 9001 or AS9100 audit completely negates its diagnostic value and wastes the initial investment of cross-functional time.
The repaired diagram must trigger scheduled reassessment. Every significant 8D closure, every major engineering change order, and every introduction of new tooling should prompt a targeted review of the relevant threat pathways. When a new operator joins a cell, the supervisor should assess whether the existing soft barriers can sustain a temporary reduction in process knowledge and muscle memory. When a supplier changes their sub-tier material source, the escalation factors mapped on the left wing of the diagram need immediate revalidation.
Software platforms can link these diagrams to live maintenance databases, calibration logs, and corrective action systems, creating automated alerts when a barrier's enforcement mechanism is compromised. But the digitisation is merely infrastructure. The analytical discipline of defining escalation factors, classifying barrier hardness, and questioning whether a control still functions under real conditions remains a human responsibility that no software platform can automate.
The value of bowtie analysis as a recovery tool lies in the cultural shift it enforces. It moves an organisation away from documenting what should have happened and toward interrogating what actually happens when controls degrade under production pressure. Plants that adopt this diagnostic mindset after a failure catch systemic weaknesses during internal reviews. Plants that rely on documented procedures alone discover those same weaknesses during the next customer audit, the next warranty claim, or the next costly field failure.
From Correction to Systemic Recovery
The difference between a corrective action and a systemic recovery is durability. A corrective action fixes the immediate finding—a broken sensor gets replaced, an expired certification gets renewed, a missing inspection step gets added. A systemic recovery rebuilds the barrier architecture so that the same failure mode cannot recur through a different operational pathway. The bowtie diagram provides the map for that rebuild by showing every node where a soft barrier was the last defence and every escalation factor that could defeat it again.
Plants that treat post-failure bowtie analysis as a one-time compliance exercise will repeat their nonconformances. The escalation factors they failed to map—material variance, workforce attrition, calibration drift, ambient noise masking alarms—will find the next unprotected pathway. The plants that embed the methodology into their change management process, their 8D closure criteria, and their internal audit programme build a control structure that degrades visibly and recovers quickly, which is the only definition of operational resilience that matters on the factory floor.
Recovery is not about restoring the documented system to its original state. That system produced the failure. Recovery is about using the forensic evidence of the breach to build something stronger: a barrier architecture enforced by physical interlocks and automated systems, validated by cross-functional teams who understand the real conditions under which their controls degrade, and sustained by a culture that treats the identification of a weakened barrier as the most valuable output a quality system can produce.