Quality KPI Trees: When Your Metrics Stop Floating in the Abstract and Finally Grow Roots on the Shop Floor
You know the feeling. You’re sitting in a monthly quality review, staring at a dashboard full of numbers — customer complaints are down 12%, scrap rate is 2.3%, first-pass yield sits at 94.7% — and someone around the table asks the question that hangs in the air like smoke:
“So… what do we actually do with this?”
The room goes quiet. Not because no one knows the answer, but because the answer requires connecting a number on a screen to a specific action on a specific machine at a specific time. And that connection — that thread from the boardroom to the shop floor — was never built.
This is the problem that Quality KPI Trees were invented to solve.
What Is a Quality KPI Tree?
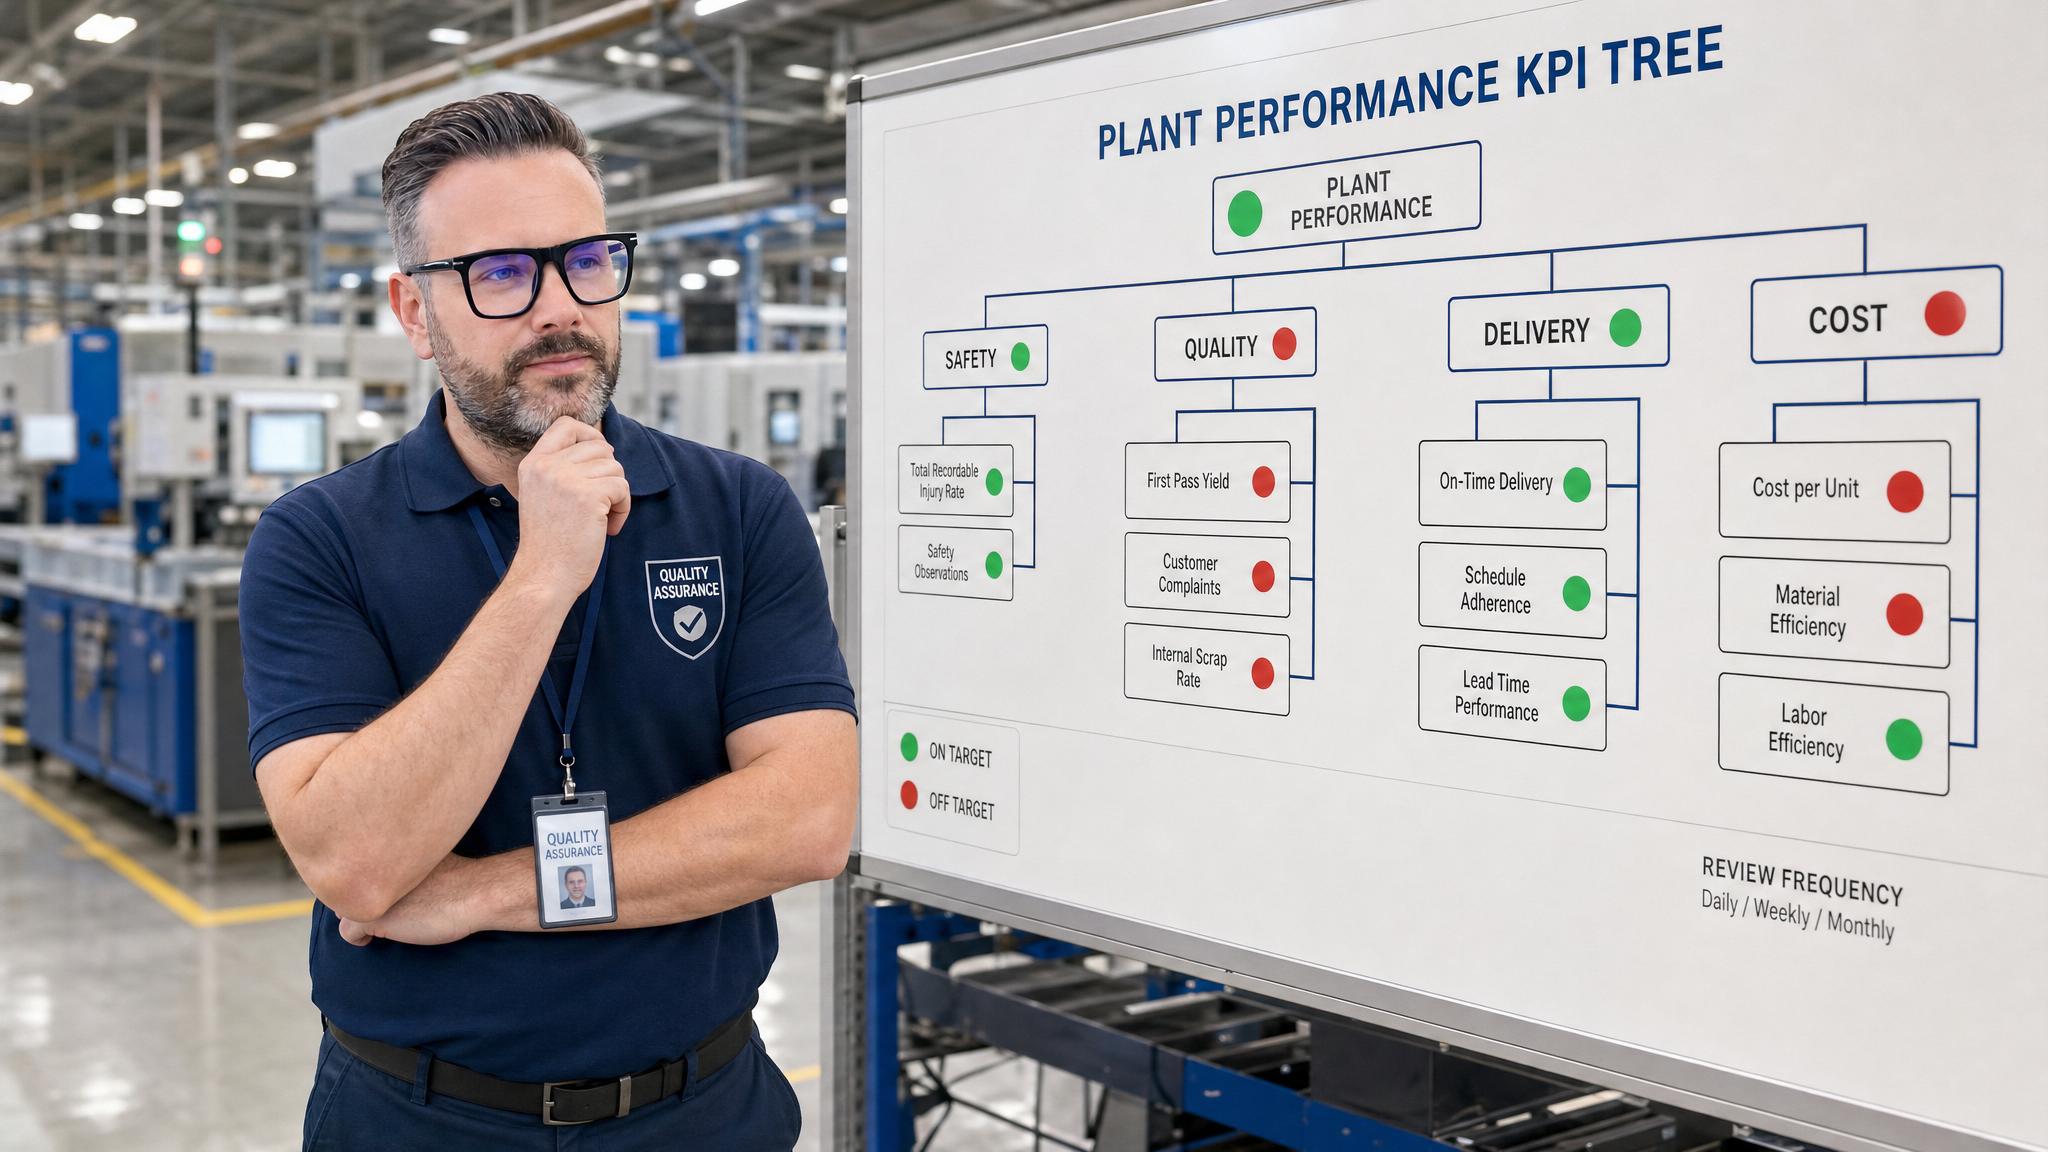
A Quality KPI Tree is a hierarchical decomposition of quality metrics that starts with your top-level strategic indicators and cascades them down through layers of increasing specificity until you reach individual process parameters that an operator can actually control.
Think of it like a real tree. The canopy — the part everyone sees — is your organizational quality performance: customer satisfaction scores, warranty costs, external PPM. Those are the leaves that catch the sunlight of executive attention. But the leaves don’t exist without branches, and the branches don’t exist without a trunk, and the trunk doesn’t stand without roots plunged deep into the soil of your daily operations.
The KPI Tree makes those roots visible. It says: this top-level metric is driven by these three intermediate metrics, which are driven by these nine operational metrics, which are driven by these twenty-seven process parameters that someone on your shop floor checks every single shift.
Without the tree, your metrics are just numbers floating in organizational space. With it, every number has a home, a parent, a child, and an owner.
Why Most Organizations Don’t Have One
Before we build one, let’s talk about why your organization probably doesn’t have one — even though the concept is straightforward.
Reason one: metrics are inherited, not designed. Most quality departments didn’t architect their KPI structure. They inherited it — from customer requirements, from ISO auditors, from industry benchmarks, from whatever the previous quality manager tracked. The result is a collection of metrics that grew like weeds, not a structure that was planted with intention.
Reason two: the wrong people chose the metrics. When senior leadership picks quality KPIs without consulting the people who actually run the processes, you get metrics that look impressive on slides but can’t be actioned. “Defects per million opportunities” means nothing to a CNC operator who just wants to know if their tool wear is within spec.
Reason three: the connection was never made explicit. Many organizations actually have the right metrics at different levels — they just never drew the lines between them. The plant manager tracks scrap cost. The line supervisor tracks scrap weight. The operator tracks reject count. These are three views of the same phenomenon, but if nobody maps the relationship, they might as well be three different languages.
The KPI Tree fixes all three of these failures simultaneously.
Building a Quality KPI Tree: A Practical Walkthrough
Let me walk you through building one, using a real-world example from an automotive parts manufacturer I worked with. We’ll start from the top and cascade downward.
Level One: Strategic Quality KPIs
These are the metrics that your executive team cares about — the ones that show up in annual reports and board meetings. For our automotive supplier, there were four:
- Customer Complaint Rate (measured in PPM — parts per million defective shipped)
- Warranty Cost as Percentage of Revenue
- External Audit Findings (major and minor nonconformities)
- Overall Quality Cost (prevention + appraisal + failure costs as a percentage of revenue)
Notice something important: these are all outcome metrics. They tell you what happened, not why it happened. They’re essential for steering the ship, but useless for trimming the sails. That’s what the next level is for.
Level Two: Tactical Quality KPIs
Now we ask: what drives each of those top-level metrics? Let’s take Customer Complaint Rate and decompose it.
Customer Complaint Rate is driven by three things: – Internal Scrap Rate (if you’re scrapping it, at least it’s not reaching the customer — but if scrap goes up, your capacity shrinks and delivery suffers, which generates complaints of a different kind) – Customer Rejection Rate (parts you shipped that the customer rejected at their incoming inspection) – Field Failure Rate (parts that passed incoming inspection but failed in the customer’s process or in the final product)
Each of these is measurable. Each has a clear relationship to the parent metric. And each can be decomposed further.
Level Three: Operational Quality KPIs
Take Customer Rejection Rate. What drives it?
- Outgoing Inspection Escape Rate (defects that your final inspection missed)
- Dimensional Nonconformance Rate (parts that don’t meet drawing specifications)
- Surface Defect Rate (visual defects that your customer catches but you didn’t)
- Material Certification Compliance Rate (paperwork and material traceability issues)
Now we’re getting specific. These are metrics that a quality engineer can own, that a production supervisor can track on a daily basis, that can be discussed in a morning standup without needing a translator.
Level Four: Process Parameters
This is where the tree touches the ground. Take Surface Defect Rate. What process parameters drive it?
- Surface roughness measurement (Ra value) — measured every 50 parts on the profilometer
- Coolant concentration percentage — checked twice per shift
- Tool wear indicator — tracked via spindle load monitoring
- Fixture clamping force — verified at changeover
- Ambient temperature in grinding area — monitored continuously
These are parameters that an operator can see, adjust, and control in real time. They don’t need to wait for a monthly report. They don’t need to interpret a trend chart. They see a number going out of range, they make an adjustment, and the effect ripples upward through the tree.
That’s the power of the KPI Tree: it creates a causal pathway from the operator’s dial to the customer’s experience.
The Rules of a Good KPI Tree
Not every decomposition qualifies as a KPI Tree. Here are the rules that separate a useful tree from a decorative chart:
Rule 1: MECE — Mutually Exclusive, Collectively Exhaustive
Borrowed from the consulting world, this principle says that at each level of decomposition, the child metrics should not overlap (mutually exclusive) and should together fully explain the parent metric (collectively exhaustive).
If you decompose Scrap Rate into “dimensional scrap” and “surface defect scrap” but forget “material nonconformance scrap,” your tree has a gap. If you overlap — counting the same defect in two categories — your tree has a leak. Either way, the numbers won’t add up, and people will stop trusting the structure.
Rule 2: Every Node Must Have an Owner
A metric without an owner is an orphan. It will not be fed, it will not be maintained, and it will die. At every level of the tree, someone must be accountable for that metric — not just for reporting it, but for acting on it.
The strategic level is owned by the Quality Director. The tactical level is owned by Quality Managers. The operational level is owned by Quality Engineers and Production Supervisors. The process level is owned by Operators and Line Technicians.
If you can’t assign an owner, the metric isn’t specific enough yet. Keep decomposing.
Rule 3: The Tree Must Be Directional
Every parent-child relationship in the tree should have a clear directional logic. “If this child metric improves, the parent metric improves.” If you can’t state that clearly, the relationship is either wrong or the metric is irrelevant.
This sounds obvious, but you’d be surprised how many organizations track metrics that don’t actually drive the outcomes they care about. A common example: tracking the number of corrective actions issued instead of the number of corrective actions effectively implemented. One is a bureaucracy counter. The other is an improvement driver. The KPI Tree forces you to be honest about which one matters.
Rule 4: Process Metrics Over Outcome Metrics at Lower Levels
At the top of the tree, outcome metrics are appropriate — they tell you where you stand. But as you cascade downward, the balance should shift toward process and leading indicators.
Why? Because by the time an outcome metric registers a problem, the problem has already happened. You want the lowest levels of your tree to be predictive, not retrospective. Surface roughness is a leading indicator of surface defects. Coolant concentration is a leading indicator of surface roughness. The further down you go, the further ahead you can see.
Rule 5: No More Than Five Children Per Node
Cognitive science tells us that humans can hold about four to seven items in working memory. In practice, if a metric decomposes into more than five children, it’s usually a sign that you’ve skipped a level or that the decomposition isn’t clean.
Keep it tight. If Customer Complaint Rate has eight drivers, group them into three or four categories and add an intermediate level. The tree should be easy to navigate, not sprawling.
Common Pitfalls
Having built KPI Trees for dozens of organizations, I’ve seen the same mistakes recur. Here are the ones to watch for:
Pitfall 1: The Phantom Tree
The most common failure mode is the organization that builds a beautiful KPI Tree, presents it at a management review, hangs it on the wall — and then never uses it. The tree becomes art, not architecture. Metrics continue to be tracked in silos, reports continue to be generated without context, and decisions continue to be made on gut feel rather than structured analysis.
The antidote: embed the tree into your operating rhythm. Start every quality review by walking through the tree. When a top-level metric moves, trace it downward to find the driver. When a process parameter shifts, trace it upward to understand the potential impact. Make the tree the lens through which you see your quality system.
Pitfall 2: The Over-Engineered Tree
Some organizations take the KPI Tree concept and run with it — building trees that go seven or eight levels deep, with hundreds of leaf nodes, requiring a database to maintain. This misses the point entirely. A KPI Tree should be simple enough to draw on a whiteboard. If you need software to understand your own metrics structure, you’ve lost the thread.
Three to four levels is usually sufficient. Five if your organization is large and complex. Beyond that, you’re building a bureaucracy, not a tool.
Pitfall 3: The Static Tree
Organizations change. Processes change. Customer requirements change. Equipment changes. A KPI Tree that was perfectly valid eighteen months ago may be obsolete today — pointing to metrics that no longer matter while missing new ones that do.
Build in a review cycle. Every six months, revisit the tree. Ask: does this decomposition still reflect our reality? Are there new drivers we need to capture? Have some metrics become irrelevant? The tree is a living document, not a monument.
Pitfall 4: Confusing Correlation with Causation
Just because two metrics move together doesn’t mean one drives the other. When building your tree, test the causal relationships. Ask: “If I improve this child metric, will the parent metric definitely improve?” If the answer is “maybe” or “it depends,” you might be looking at a correlation, not a cause.
This is where process knowledge is irreplaceable. The KPI Tree is a framework, not a substitute for understanding how your processes actually work. The best trees are built by cross-functional teams that combine quality expertise with deep process knowledge.
The KPI Tree as a Communication Tool
Here’s something that’s often overlooked: the KPI Tree is one of the most powerful communication tools in quality management.
When a customer auditor asks, “How do you ensure quality performance at the process level?” you don’t need to fumble through a collection of control plans and inspection records. You show them the tree. You trace the path from their customer-specific requirement down to the process parameter that controls it. You show them the owner at each level. You show them the data flow.
I’ve seen auditors go from skeptical to impressed in thirty seconds flat when presented with a well-constructed KPI Tree. Not because it’s a flashy visual, but because it demonstrates a level of systematic thinking that most organizations only claim to have.
Similarly, the tree is invaluable for onboarding new quality engineers and production supervisors. Instead of drowning them in a sea of metrics and expecting them to figure out the relationships on their own, you give them the tree. “Here’s how our quality system is connected. Here’s where you fit. Here’s what you own, and here’s why it matters.” Six months of learning compressed into a single diagram.
Digital KPI Trees and Industry 4.0
In a modern manufacturing environment, the KPI Tree takes on a new dimension. When your machines are connected, your measurement systems are automated, and your data flows in real time, the tree can become dynamic.
Imagine a digital dashboard that doesn’t just show you numbers but shows you the tree — with each node color-coded green, yellow, or red based on current performance. You see a red node at the top (customer complaints trending up), and with one click, you drill down to see which tactical metric is driving it. Another click, and you see the operational metric. One more, and you’re looking at the specific process parameter that’s out of range — in real time.
This isn’t science fiction. Several QMS platforms now support hierarchical metric structures. The challenge isn’t the technology — it’s the thinking. You need the tree before you can digitize it. And the thinking is what most organizations skip.
Building Your First KPI Tree: A 30-Day Plan
If you’ve read this far and want to build your own Quality KPI Tree, here’s a practical roadmap:
Week 1: Audit your current metrics. List every quality metric your organization currently tracks. Don’t judge them yet — just inventory. You’ll probably find you’re tracking 40-60 metrics across different levels and departments.
Week 2: Identify the top-level KPIs. From your inventory, select the 3-5 metrics that represent your organization’s quality performance at the highest level. These should be outcome metrics that matter to your customers and your leadership.
Week 3: Cascade downward. For each top-level KPI, identify its primary drivers (3-5 per metric). Then decompose each of those into operational metrics. Then into process parameters. Draw the tree. Test the causal relationships. Assign owners.
Week 4: Validate and refine. Present the tree to the people who own each level. Ask them: does this make sense? Does this reflect your reality? What’s missing? What’s wrong? Refine based on their input. Then embed it into your operating rhythm.
Thirty days. One tree. A fundamentally different way of seeing your quality system.
The Deeper Truth
Here’s what the KPI Tree really does — something that goes beyond metrics and dashboards and operating rhythms: it creates shared understanding.
When the Quality Director sees the same tree as the CNC operator — maybe at different levels, with different nodes highlighted, but the same structure, the same logic, the same causal pathways — something profound happens. The organization starts speaking the same language. Decisions made at the top start making sense at the bottom. Actions taken at the bottom start adding up at the top.
The KPI Tree isn’t just a measurement framework. It’s a translation device. It takes the abstract language of quality strategy and converts it into the concrete language of process control. And in doing so, it closes the gap that exists in almost every manufacturing organization — the gap between knowing that quality matters and knowing what to do about it.
Your metrics already contain the answers. The KPI Tree just helps you hear them.
Peter Stasko is a Quality Architect with 25+ years of experience turning chaotic manufacturing environments into systems of predictable excellence. He has implemented Quality KPI Trees across automotive, aerospace, and medical device organizations on three continents — and has never once seen an organization that didn’t need one.