Most manufacturing plants do not solve problems; they manage them. They contain defects, build workarounds, and develop elaborate coping mechanisms. I have audited dozens of facilities where the same defect triggers the same emergency meeting, generates the same subjective theories, and ends with the same vague mandate to investigate further.
This opinion-driven approach fails because the loudest or most senior voice in the room dictates the direction. Context-free solutions are pulled from conference anecdotes and applied without root cause verification. The result is predictable: the defect rate fluctuates temporarily, the team claims progress, and the problem returns three months later under a different part number.
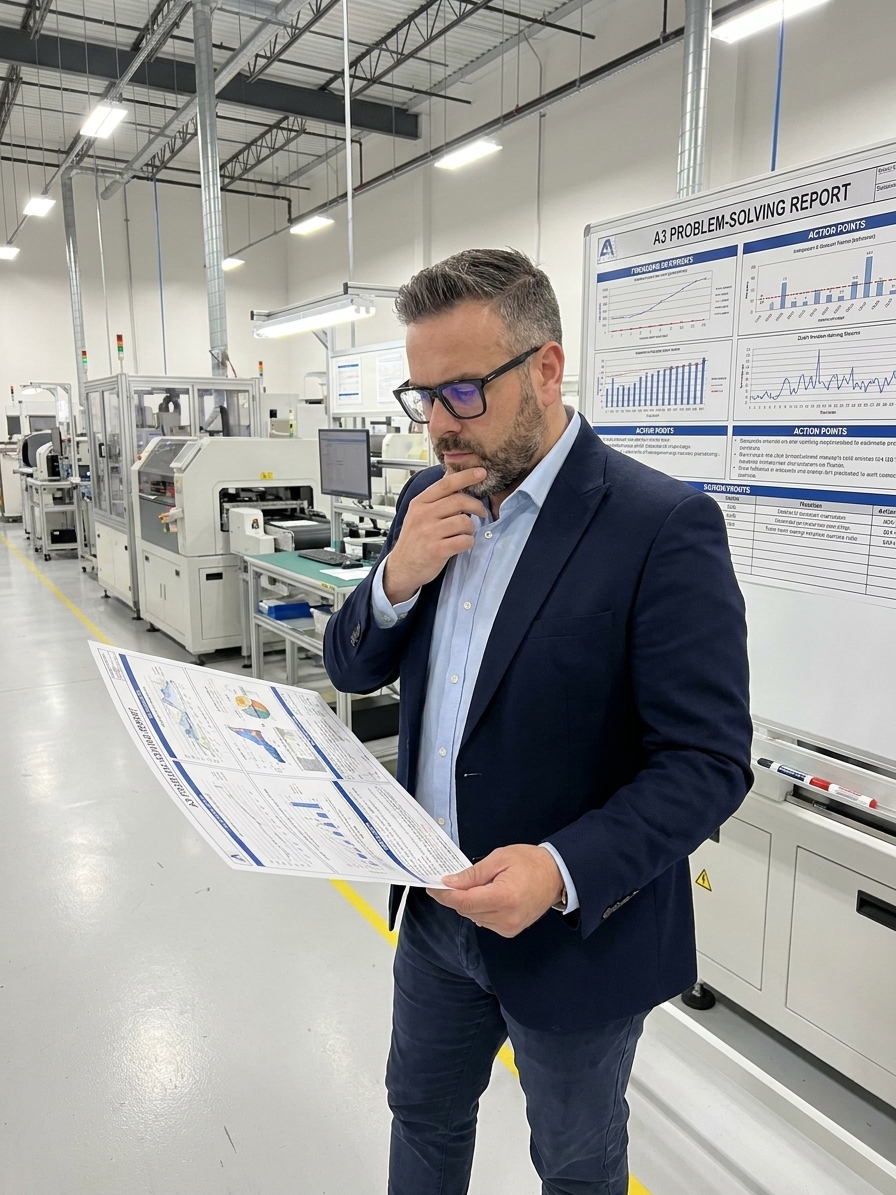
A3 thinking solves this by forcing clarity. Originating within the Toyota Production System, the A3 report is a single sheet of 11×17-inch paper that tells the complete story of a problem. It takes the reader from the current condition through root cause analysis, targeted countermeasures, and verified results. It eliminates verbal ping-pong and replaces it with a visible chain of logic.
The Mechanics of an A3 Report
The physical paper size is the least important element; the structured thinking is the point. A standard A3 follows a rigid sequence that prevents problem-solvers from jumping straight from symptom to solution. Each section demands specific, verifiable data before the team can move forward.
The document is divided into nine distinct sections. It begins with the business context and a data-driven map of the current condition. It forces the author to define a measurable target condition, isolate the root cause using tools like 5 Whys or a fishbone diagram, and propose specific countermeasures with clear ownership and deadlines.
The final sections close the loop. An implementation plan details the execution steps and resource requirements. The follow-up section defines exactly how the team will verify that the countermeasure worked, tracking specific metrics over a set timeframe. Finally, the results and lessons learned sections institutionalise the outcome.
The A3 Problem-Solving Sequence
- 01Current ConditionDirect observation of the process, mapped with actual cycle times and defect counts.
- 02Root Cause AnalysisApplication of 5 Whys or fishbone diagrams to isolate the specific failure mechanism.
- 03Target ConditionA specific, measurable definition of success, such as reducing defect rate to under 1%.
- 04CountermeasuresTargeted actions aimed precisely at the verified root cause, not the symptom.
- 05VerificationFollow-up metrics tracked over time to prove the countermeasure held.

The Gemba Discipline: Go and See
You cannot write an accurate current condition from a desk. A3 thinking demands that the author goes to the actual place where work happens and observes the process directly. This means timing the steps, counting the defects, and mapping the physical flow of material. Secondhand reports are unacceptable.
This gemba observation forces the separation of symptoms from causes. The most common problem-solving error in manufacturing is confusing the two. The statement that a line has too many defects is merely a symptom. The specific fact that a fixture alignment drifts after 200 cycles because a locking mechanism wears unevenly is a root cause.
Thinking in systems is the natural byproduct of this observation. When a defect appears at final inspection, the root cause might lie in incoming material inspection, machine setup parameters, or preventative maintenance schedules. Direct observation prevents the team from stopping at the first plausible explanation.
Resolving Dimensional Variation: A Case Study
Consider an automotive supplier facing persistent dimensional variation on a machined aluminium housing. The defect rate sat at 3.2 percent, generating 256 defective units per month out of an 8,000-unit volume. At a rework cost of $47 per unit, the monthly loss exceeded $12,000. The customer was threatening a line stoppage if the rate remained above 1 percent.
For six months, the team applied opinion-driven fixes. They adjusted machine parameters, increased tooling change frequency, and added an inspection step. The defect rate fluctuated between 2.8 and 3.5 percent, never achieving sustainable improvement. These were solutions searching for a problem.
A structured A3 approach changed the outcome. The quality engineer went to the line, measured 50 consecutive parts, and mapped the process. The data revealed that parts machined during the morning shift were consistently more variable than afternoon parts. The variation was not random; it was systemic.
Using 5 Whys, the engineer traced the pattern to machine temperature. The machine was shut down overnight and took 45 minutes to reach thermal equilibrium. Because production started immediately at shift change, the first cold-soaked parts were machined outside of tolerance. The total cost of the solution—a 30-minute warm-up cycle before production—was zero dollars.
Impact of Thermal Warm-Up Countermeasure
Common Implementation Failures
Organisations fail at A3 thinking because they treat the document as an administrative task rather than a cognitive discipline. The most frequent failure mode is the decorated report. Teams spend hours formatting charts and typography in PowerPoint, obscuring a fundamentally shallow analysis. A hand-drawn A3 with rigorous logic holds infinitely more value than a glossy printout with no depth.
The shortcut A3 is equally destructive. Teams often claim they already know the root cause and try to skip straight to the countermeasure section. If the root cause were genuinely understood, the problem would already be solved. Walking through each section sequentially is the discipline that forces hidden variables into the open.
If your A3 points to a person instead of a process, start over.
Blame is another systemic failure. An A3 concluding that operators need more training or maintenance failed to do their job has fundamentally failed at root cause analysis. Human error is a symptom of a process that allows for error, not a root cause. Systems thinking demands that the countermeasure addresses the process vulnerability, not the operator.
Coaching Through the A3 Process
At Toyota, the A3 process functions as a leadership development tool. A junior engineer drafts the report, and the manager coaches them through Socratic questioning. The manager never solves the problem for the engineer. They ask whether the author observed the process firsthand, what evidence supports the root cause, and what alternative explanations were rejected.
Through this dialogue, the engineer learns to distinguish observation from assumption and correlation from causation. The coaching session builds critical thinking skills that standard 8D or troubleshooting manuals cannot teach. The framework turns a one-off problem into a repeatable capability.
This is why A3 thinking operates at a level above isolated quality tools. 5 Whys, fishbone diagrams, and Pareto charts are merely techniques. A3 thinking is the architecture that organises these techniques into a verified, end-to-end problem-solving narrative.
Deploying A3 Thinking in Your Facility
Do not launch a company-wide A3 initiative. Pick one specific operational problem that matters to the business. The problem must be narrow enough to address in a two-to-four-week window. It needs measurable outcomes and a clear boundary, but it cannot be so critical that production pressure destroys the learning environment.
Use pencil and paper for the first drafts. The temptation to jump directly into spreadsheet formatting is the temptation to prioritise aesthetics over cognitive rigour. Hand-writing forces the author to feel the constraint of the page, demanding that every word earns its place on the sheet.
Finally, write a rigorous follow-up plan. Define the exact metrics, the measurement intervals, and the responsible owners. Update the A3 with the actual results after 30 days. This transforms the exercise from a theoretical discussion into a validated, institutionalised solution.