A customer reports a defective unit. Your quality team mobilizes, forms an 8D group, and swarms the production line the customer mentioned. The shift supervisor supports the move because that line had a dramatic shutdown last month. Meanwhile, the actual source of the defect continues running unchecked.
This is the base rate fallacy at work. Human cognition privileges vivid, specific stories over abstract probabilities. When a specific incident occurs, investigators overweight recent memories and dramatic failures while systematically ignoring the underlying statistical probability of the event.
In quality management, this cognitive bias costs organizations millions. Teams waste resources chasing anomalies while high-frequency defect sources quietly continue shipping nonconforming product. The fix requires structural changes to how you launch investigations, prioritize risk, and visualize data.
Defining the Base Rate Problem in Manufacturing
The base rate fallacy occurs when people ignore the underlying frequency of an event and instead overweight specific, vivid information. Consider a plant producing 50,000 units across five lines. Line A produces 20,000 units daily with a 0.1% defect rate. Line E produces 2,000 units with a 5.0% defect rate.
When a customer reports a defect, the math is straightforward. Line A produces roughly 20 defective units per day. Line E produces approximately 100. The defect is five times more likely to originate from Line E. However, if the customer mentions a rumor about maintenance on Line A, your team will fixate on Line A.
They will ignore Line E's base rate, which makes it the statistically probable source. This is not a failure of intelligence. It is how human brains process information. In a quality environment, that processing error leads directly to misallocated engineering resources and sustained quality escapes.
How Cognitive Bias Derails CAPA and FMEA
The base rate fallacy fractures risk prioritization. During PFMEA reviews, teams should evaluate failure modes based on historical occurrence data. Instead, they anchor on the most memorable recent failure. Low-occurrence failures with dramatic consequences receive inflated RPN scores, dominating the review.
High-occurrence failure modes with less dramatic presentations get scored as low priority. Your FMEA becomes a reflection of what your team remembers most vividly, not what is statistically most likely to fail. The same bias distorts supplier management and corrective action systems.

A supplier sends one bad lot that causes a line stop, triggering immediate probation and audits. Meanwhile, a second supplier ships material consistently drifting at the edge of specification. That drift causes downstream variation resulting in more total defects over a year, but the first supplier gets all the attention.
When you ignore base rates, your corrective actions target the wrong root causes. You fix the dramatic incident instead of the systematic pattern. Your CAPA system fills up with actions that addressed symptoms while the underlying statistical reality went unchanged.
Incident-Driven vs. Base Rate-Driven Quality
What incident-driven teams do
- Launch 8D investigations based on customer complaints
- Prioritize FMEA by the most dramatic recent failure
- Allocate engineering resources to the loudest supplier
- Treat audit nonconformities as isolated emergencies
What base rate-driven teams do
- Pull historical SPC data before forming any hypotheses
- Prioritize FMEA by historical occurrence and detection data
- Monitor supplier Cpk drift alongside line-stop incidents
- Treat audit findings as indicators of systemic base rates
The False Positive Trap in Inspection
The base rate fallacy severely distorts inspection outcomes. Consider a non-destructive test that is 95% accurate. It correctly identifies 95% of defective parts and correctly passes 95% of good parts. Most quality professionals assume a positive result means a 95% probability of a real defect.
Now factor in the base rate. If this specific defect occurs in 1 out of every 1,000 parts (0.1%), the statistical reality changes entirely. Applying Bayes' theorem reveals that the actual probability a flagged part is defective is roughly 1.9%.
Out of 1,000 parts, 1 is truly defective and correctly flagged. However, the 999 good parts generate roughly 50 false positives. For every truly defective part the test finds, it sends 50 good parts for unnecessary re-inspection, rework, or scrap.
If your team does not understand base rates, they will trust every flag as a real defect. I have seen plants spend months upgrading cameras and retraining operators to address high reject rates, only to find the true defect rate was already near zero. They were chasing false positives driven by a low base rate.
Anchoring 8D Investigations to Statistical Reality
To defeat the base rate fallacy, you must restructure how your organization initiates investigations. Audit culture, customer complaints, and the 8D process itself all start with a specific, dramatic incident. The temptation is to treat that specific failure as representative of the entire system.
Control charts already show you base rates — they are the center line. But most people only look for the spikes.
Before anyone states a hypothesis about what caused a defect, pull the data. What are the historical defect rates by line, by shift, by operator, by supplier? What does the Pareto chart of defect causes look like over the past twelve months? The data must precede the narrative.
I have audited plants where the quality team spent three days tearing down a recently flagged press, only to discover that an unremarkable neighbouring press had been running with a surface defect rate four times higher for six weeks. The base rate was in the SPC charts the entire time.
Separate signal detection from storytelling. When a defect occurs, you must detect the signal before you construct an explanation for management. Create a culture where no root cause hypotheses are accepted until the base rates have been checked against the historical record.
Embedding Bayesian Logic in Quality Teams
Quality professionals are not immune to this bias simply because they are trained in statistics. The nature of the work exacerbates it. Improvement projects need sponsors, and to get resources, you need a compelling story. Stories are specific; base rates are abstract. The projects that get funded are the ones with the best stories.
The Base Rate-First Investigation Sequence
- 01Quarantine and containIsolate the specific defective lot and protect the customer.
- 02Mandate a base rate checkPull 12 months of SPC and Pareto data for this failure mode across all lines.
- 03Identify the statistical sourceDetermine which line or process actually generates the highest volume of this defect.
- 04Formulate hypothesesBuild root cause theories that explain both the specific incident and the base rate.
You do not need to turn every engineer into a statistician, but you must train your team in Bayesian thinking. The probability that a hypothesis is true depends not just on how well the evidence fits the hypothesis, but on how likely the hypothesis was before you saw the evidence.
A training module using examples from your own plant's data can transform how your team approaches investigations. Make it part of your quality system onboarding. Add mandatory base rate questions to your investigation checklists to force engagement before the team commits to a path.
- What is the historical defect rate for this specific failure mode?
- Is this incident consistent with the base rate, or is it an anomaly?
- Are we investigating this because the data points here, or because it is memorable?
Building Systems That Visualize Base Rates
Organizations that master this distinction share a common characteristic: they lead with data in every meeting. The first slide in every quality review shows the base rates. Opinions, anecdotes, and floor rumours are not accepted until the statistical context has been established and reviewed.
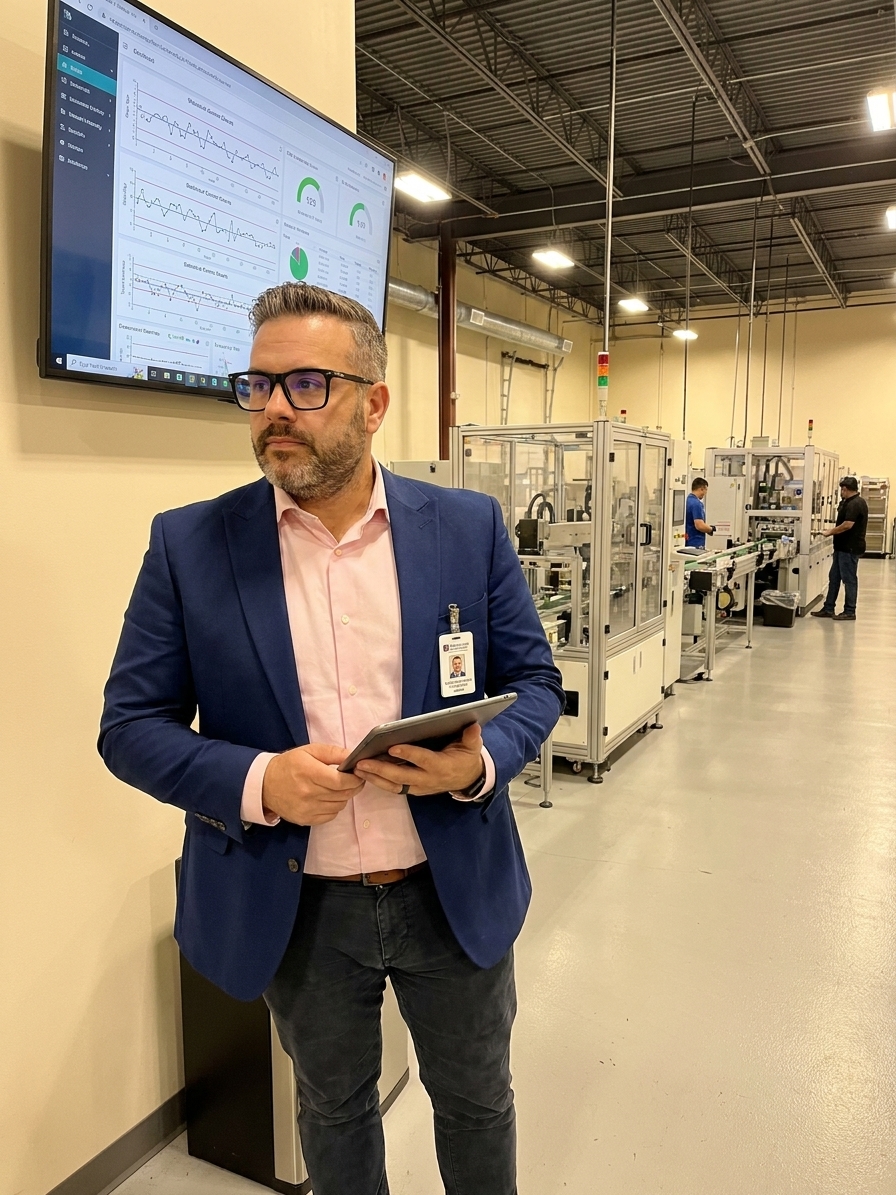
Make the question 'What is the base rate?' as natural as 'What is the root cause?' Add base rate dashboards to your gemba walks, management reviews, and FMEA reviews. Post defect rate distributions where everyone on the shop floor can see them.
These visualizations are not tools for the quality department. They are communication devices that keep the entire organization anchored to statistical reality. When a dramatic failure occurs, acknowledge it, contain it, and then check the data before deciding how deeply to investigate.
Not every dramatic failure deserves a full 8D investigation. But every high-base-rate failure mode deserves sustained attention, even when it is entirely unremarkable. Your process data is constantly communicating where your systemic risks live. The discipline lies in listening to the statistics before getting swept away by the incident.