
Picture the scene following a severe line failure and a critical customer rejection. The room is filled with engineers, quality specialists, and managers searching for answers. Someone proposes a new poka-yoke, another demands a software upgrade, and the quality manager suggests refresher training. Within thirty minutes, the whiteboard is covered in sticky notes and arrows, but the team is merely reacting to symptoms.
Scattergun approaches fail because they do not map the mechanics of the failure itself. You need a shared visual language that connects root causes to preventive actions and realistic consequences on a single page. The bowtie model provides exactly this framework. It takes its name from its shape: threats on the left, the central top event, and consequences on the right, with barriers standing between them.
The methodology forces cross-functional teams to look beyond linear cause-and-effect logic. It synthesises engineering controls, human factors, and organisational gaps into one comprehensive view that is immediately actionable on the shop floor.
Why the Bowtie Model Outperforms Standard Quality Tools
Quality professionals might ask why they need another tool alongside PFMEA, Ishikawa diagrams, and 5 Whys. The answer lies in what those existing tools fail to do. PFMEA is analytical: it functions like a microscope examining individual failure modes and severity scores, but it often loses the systemic context of how failures escalate in reality.
Ishikawa diagrams effectively categorise causes into 6Ms (Man, Machine, Method, Material, Measurement, Environment), yet they completely ignore the consequences of those triggers. The 5 Whys technique relies on linear logic, tracing a single path downward. However, real manufacturing failures rarely happen in isolation. One trigger can cascade into multiple distinct consequences simultaneously.
The bowtie model is a synthetic tool. It takes the granular data generated by your PFMEA and visualises it. You can use Ishikawa to populate the left side with threats, and use 8D reports to verify your mitigating barriers. It bridges the gap between deep engineering analysis and operational awareness.
Bowtie vs Traditional Quality Tools
What traditional tools do
- PFMEA scores failure modes but misses systemic escalation
- Ishikawa categorises causes but ignores downstream impact
- 5 Whys assumes failures follow a strictly linear path
- 8D solves a specific problem but rarely maps systemic risk
What the bowtie model adds
- Visualises multiple paths a threat can take to become a failure
- Links causes directly to specific preventive barriers
- Maps out realistic downstream consequences simultaneously
- Acts as a living operational document for the shop floor
Building the Diagram: From Threats to Mitigations
The first step is defining the top event with absolute precision. 'Poor quality' is not a top event. 'Loss of containment' is too vague for manufacturing. A proper top event might be 'Microcracking on gear teeth after heat treatment' or 'Brake disc contamination before assembly'. The specific definition anchors the entire analysis.
Once the centre is fixed, you identify threats on the left. Do not limit this to technical failures. Human factors, organisational weaknesses, and environmental changes must all be included. Each threat represents a specific trigger that could breach your preventive defences and cause the top event.
Between the threats and the top event, you install preventive barriers. These are the controls that stop the trigger from escalating. For every identified threat, define what currently prevents it. If a threat has only one barrier, you have a single point of failure. A robust system requires at least two independent preventive controls per threat.
Anatomy of a Bowtie Diagram
- 01ThreatsLeft side triggers: e.g. furnace temperature deviation, untrained operator, raw material change.
- 02Preventive BarriersControls that stop the trigger: e.g. PID regulation, standardised work, PPAP revalidation.
- 03Top EventThe central occurrence you are trying to prevent: e.g. microcracking post-heat treatment.
- 04Mitigating BarriersReactive controls to limit damage: e.g. 100% eddy current testing, automated batch isolation.
- 05ConsequencesThe real-world impact if mitigations fail: e.g. field failure, OEM contract loss, regulatory penalty.
Applying the Model to Latent Defects
I have worked with automotive suppliers plagued by latent defects that only surface after 15,000 km in a customer's vehicle. One facility producing transmission gears faced recurring microcracks after carburising. After two customer complaints and a costly recall, we gathered the team to build a bowtie diagram on a flipchart, rather than debating action items in a spreadsheet.
We defined the top event as 'Microcrack formation in gear teeth during quenching'. The team mapped four primary threats: temperature non-uniformity in the furnace, incorrect carbon potential in the atmosphere, excessive cooling speed in the quench bath, and incorrect part orientation in the basket.
We then mapped the preventive barriers. The existing controls were found wanting. The furnace relied on outdated heating elements with no thermovision audits. The carbon potential sensor lacked redundancy. The quench bath temperature sensor was calibrated annually instead of quarterly.
A barrier that exists only on a paper procedure is not a control; it is an illusion. You must verify its effectiveness on the shop floor.
By installing dual sensors, implementing thermovision checks, and adding photo references for basket loading, we established redundancy. A month later, an operator noticed a failing temperature sensor and stopped the line independently, knowing from the diagram that the preventive barrier had fallen.
Integration with IATF 16949 and ISO 9001
The bowtie model directly satisfies the risk-based thinking mandated by ISO 9001:2015 Clause 6.1. It forces organisations to move beyond vague risk matrices and identify specific actions to address threats and opportunities. The diagram is a visual proof that system-level risks have been analysed.
Under IATF 16949:2016 Clause 6.1.2.1, the standard requires documented analysis of risks. A bowtie diagram serves as this documentation. Auditors can trace specific threats to their respective preventive barriers within seconds, demonstrating a clear logic path.
More importantly, Clause 8.5.2.1 dictates control plan requirements. Every preventive and mitigating barrier mapped in your bowtie diagram must correspond to a specific entry in your control plan. If a barrier exists on the wall but not in the control plan, you have a systemic disconnect.
Audit Readiness Through Visualisation
During audits, I have seen operators flawlessly explain complex process risks by pointing to a bowtie diagram hung next to their workstation. This level of operator awareness regarding specific barriers consistently impresses IATF auditors far more than an archived file of FMEA spreadsheets.
Critical Success Factors and Deployment
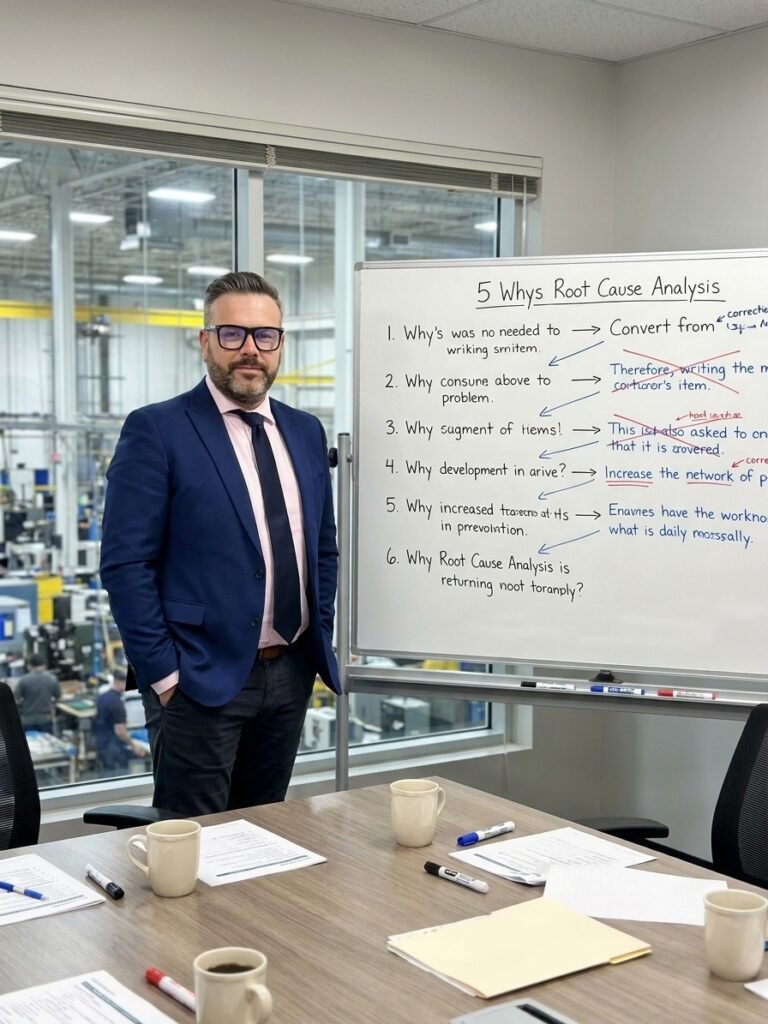
Teams must build the initial diagram collaboratively using a whiteboard and markers. Attempting to construct the model directly in proprietary software limits participation. The software is only useful later for digitising the agreed-upon structure and generating formal reports.
A comprehensive bowtie requires diverse perspectives. Operators understand the daily threats and procedural realities. Process engineers specify the technical barriers and tolerances. Management quantifies the severity of consequences and regulatory fallout. Leaving any of these stakeholders out results in a compromised diagram.
The model is a living document. Every 8D closure, every new customer complaint, and every process layout change must trigger a review of the diagram. If a failure occurs that your diagram did not predict, you must immediately update the barriers to reflect the newly identified threat.
Digitising Barriers for Industry 4.0
Leading facilities are now integrating bowtie logic into digital twin architectures and Manufacturing Execution Systems (MES). Barriers are linked directly to live machine data. When a preventive control is breached, such as a furnace exceeding temperature limits, the corresponding barrier on the digital diagram turns red.
This integration allows for automated alerts. If two barriers fall simultaneously, the MES can automatically lock the station and quarantine the affected parts, preventing a top event from ever occurring. The diagram ceases to be a static report and becomes an active layer of operational defence.
The technology does not replace the fundamental methodology. Without a properly constructed manual bowtie defining the logic, digital alerts are merely noise. The value lies in understanding the systemic relationships before you attempt to automate them.
Complex risk management fails when it remains trapped in closed files. The bowtie model strips away the complexity of quality standards and returns the focus to the fundamentals: identify the triggers, build redundant controls, limit the fallout, and make the entire system visible to the people running the line.