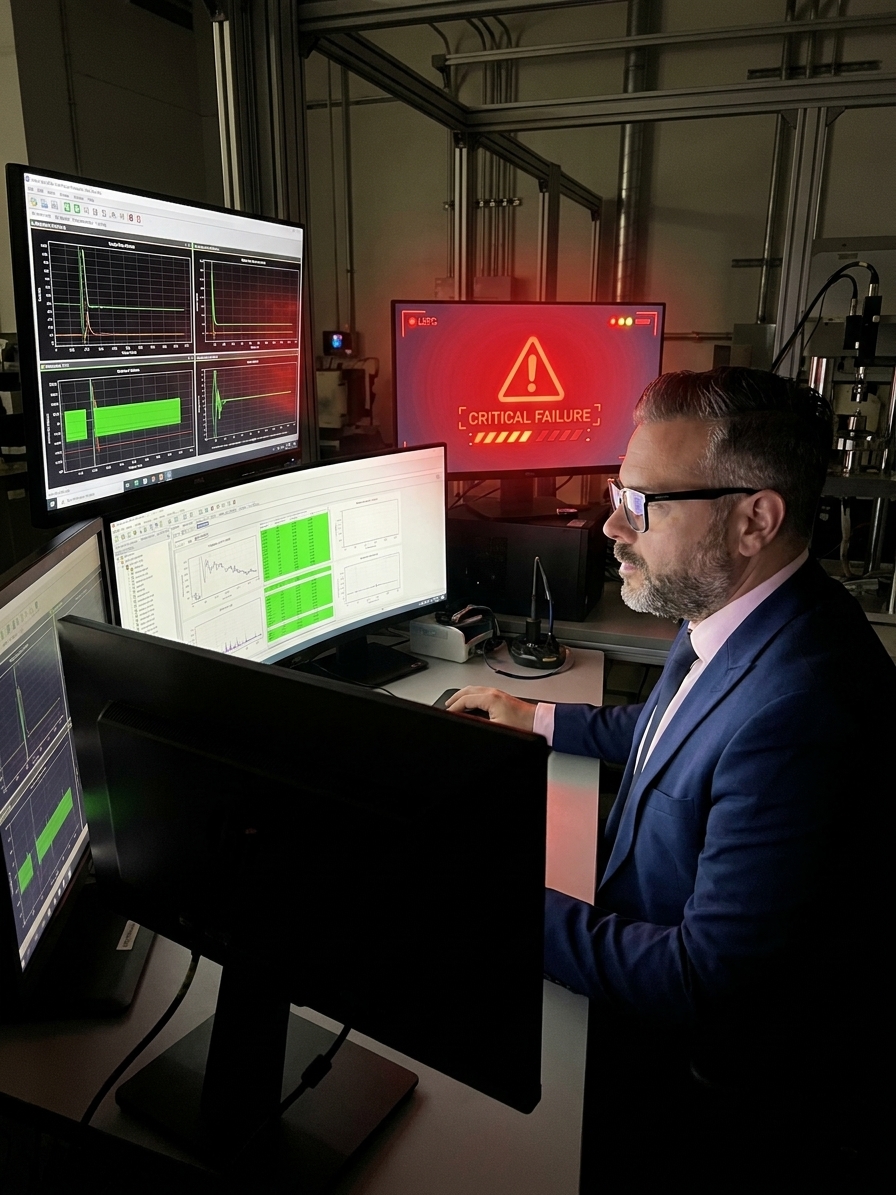
A quality engineer reviews three nonconforming units from a morning shift run. The first shows a dimensional deviation on a milled surface, consistent with tool wear on CNC Station 7. The second and third units show the exact same deviation. The engineer writes the nonconformance report, flags the station for a tool change, and closes the loop.
What went unexamined was the fourth unit in that batch. It passed inspection, but it carried a hairline weld crack that will propagate under fatigue loading 18 months later in the field. It went untouched because the engineer was looking for tool wear. The dimensional error was real, and the cracked weld was real. Only one of them fit the narrative already running in the engineer's head.
This is confirmation bias operating on a shop floor. It is the systematic tendency to search for, interpret, and favour information that confirms pre-existing beliefs while ignoring data that contradicts them. It is not a character flaw or a lapse in diligence. It is the default operating mode of human cognition, and it actively shapes every quality system, root cause investigation, and final inspection you will ever run.
In my experience implementing and auditing ISO 9001 and IATF 16949 systems across automotive and aerospace plants, this cognitive blind spot is vastly more expensive than a mis-calibrated gauge. It dictates which defects you uncover, which root causes you pursue, and which systemic problems you allow to persist until they become field escapes.
The Mechanics of Selective Quality Perception
Cognitive psychology has long established that humans are not neutral evidence-gathering machines. When people form a hypothesis, they instinctively search for evidence that proves it rather than data that falsifies it. We look for confirming examples and stop testing once we find them.
In manufacturing quality, this plays out through highly specific, expensive mechanisms. An inspector who is briefed that a particular station produces burr defects will subconsciously prioritise their visual scanning for burrs. They will find the burrs. They will walk straight past the surface contamination or the misaligned datum that a fresh set of eyes would catch immediately.
Industry studies on visual inspection show that detection rates for expected defect types routinely sit between 70% and 85%. For unexpected defects, modes that are present but not primed in the inspector's expectations, detection rates can plummet below 30%. You are paying for a full inspection but delivering a partial one, with the gap occurring precisely at the edge of your operational blind spots.
This gap carries a heavy consequence during process changes. When you introduce a new product variant, your experienced inspectors will continue finding legacy defect types while entirely missing the new failure modes. This transition period, when both old and new defects coexist, is exactly when confirmation bias drives the highest rate of customer field escapes.

How Bias Corrupts Root Cause Analysis
When a defect escapes, the 8D investigation team assembles with immediate hypotheses drawn from experience. The team decides the issue looks like a coolant concentration problem, or perhaps a training gap on the second shift. Each of these hypotheses triggers a highly specific search pattern. The team looks for evidence of low coolant and finds it.
What teams rarely do is systematically search for evidence that would disconfirm their leading hypothesis. They find something close enough to the suspected cause, implement a corrective action, and close the 8D. Six months later, the identical defect reappears because the actual systemic root cause was never investigated. The first hypothesis felt sufficient, so the investigation stopped.
This dynamic is even more insidious in statistical process control. When a process shift occurs in a favourable direction, moving a critical dimension closer to target, engineers rarely investigate. A point beyond the upper control limit is treated as a gift rather than a statistical signal. But an unexplained favourable shift indicates an undocumented process change, one that might be quietly degrading tool life or altering material properties downstream.
Conversely, when an unfavourable shift triggers a scrap alert, the first institutional instinct is often to disqualify the data. The team questions the gauge calibration or asks if the operator was properly trained. The investigation begins with an attempt to defend the status quo rather than an effort to understand what physically changed on the machine.
Confirmation Bias vs. Falsification in 8D
Confirmation approach (Standard)
- Form a single hypothesis based on past experience.
- Search SPC and gauge data for confirming evidence.
- Stop investigating once a plausible link is found.
- Implement action and close the 8D report.
Falsification approach (Structured)
- Generate at least three alternative causal hypotheses.
- Define the data needed to eliminate each one.
- Actively search for disconfirming evidence.
- The surviving hypothesis becomes the root cause.
Supplier Scorecards and Self-Fulfilling Narratives
Organisations develop deep-seated narratives about their supply base. Supplier A is highly reliable. Supplier B is chronically problematic. Once these narratives solidify, incoming inspection data is interpreted entirely through them. A critical nonconformance from Supplier A is written off as a one-time logistics anomaly.
The exact same nonconformance from Supplier B triggers an immediate supplier corrective action request (SCAR) and an on-site audit. Over time, this differential response creates a self-fulfilling prophecy. Supplier B receives escalating scrutiny, and naturally, more defects are found. Supplier A receives less oversight, allowing quality issues to accumulate undetected until they trigger a line-down situation.
Your supplier scorecard, which is intended to provide an objective measure of performance, becomes a confirmation engine. The PPM metrics that support the established narrative are highlighted in management reviews. The metrics that contradict the narrative are footnoted, caveated, or dismissed as one-time outliers. The data is technically accurate, but the interpretation is structurally compromised.
We see the same filtering effect in customer complaint analysis. If a major account reports a defect, the default assumption is that the product failed. If a small or technically unsophisticated customer reports the identical defect, the default assumption is that it is a perception or usage error. Defects reported by smaller accounts take significantly longer to investigate and close, purely because the organisational narrative assigns them a lower prior probability of validity.
Why Adding More Data Amplifies the Error
A common assumption in Industry 4.0 manufacturing is that more data will eliminate human bias. The belief is that if a facility collects enough measurements, runs enough automated SPC charts, and tracks enough OEE metrics, objective truth will automatically emerge. This belief is dangerously flawed.
Data does not interpret itself. People interpret data, and they bring their institutional incentives and cognitive defaults to every analysis. I have audited plants where the same set of dimensional inspection data was reviewed by different engineering shifts, and the identified root causes correlated almost entirely with each engineer’s departmental background rather than the physical evidence.
Adding more data to a biased interpretation process does not reduce bias. It amplifies it. Given enough variables and enough machine data, a biased analyst can always find a statistical correlation that confirms their preferred story. If you believe a machine is failing, you will find a vibration spike that proves it. If you believe the machine is fine, you will find a gauge R&R study that blames the measurement system instead.
The most dangerous quality problem in your facility is not a defective process. It is the way your quality team interprets the data from that process.
Designing Disconfirmation Into Your Quality System
Countering confirmation bias requires structural changes to how you handle data, not motivational posters. The first intervention is mandatory alternative hypothesis generation. Before starting a root cause investigation, require the engineering team to write down at least three alternative causes, including the null hypothesis that the defect is entirely random.
For each hypothesis, the team must define what evidence would eliminate it before they begin pulling data. This forces a disconfirmatory approach. The investigation stops when only one hypothesis survives falsification, rather than stopping the moment a plausible answer is found. This should be a mandatory gate in your 8D template.
The second intervention is routine inspector rotation. An inspector checking the same product line for three years has highly efficient detection for expected failures and near-zero detection for unexpected ones. Moving inspectors across stations and product variants breaks their expectation patterns. New inspectors are initially slower, but they routinely uncover critical defects that experienced operators have walked past for months.
The third intervention is blind data analysis for safety-critical or chronic defects. Remove all identifying information from the dataset before the quality engineer begins their review. Do not reveal which supplier produced the batch, which shift ran the machine, or which operator was present. Force the data to reveal the pattern without the weight of the organisational narrative attached.
Blind Data Analysis Protocol
- 01Scrub the dataRemove supplier names, shift identifiers, and operator IDs from production records.
- 02Define variablesList the physical process parameters (temperature, pressure, cycle time) to be analysed.
- 03Isolate correlationIdentify which process variables correlate directly with the failure mode.
- 04Reintroduce contextOverlay the shift and supplier data only after the physical root cause is established.
The Meta-Problem: Experience vs. Calibration
The most insidious aspect of confirmation bias is that the people who most need to address it are the most confident they are immune. Experienced quality professionals, engineers with decades of investigation experience, are precisely the demographic most vulnerable to this cognitive trap. Their deep experience has built a rich library of patterns they recognise and trust implicitly.
Experience is vital, but pattern recognition and confirmation bias use the exact same cognitive mechanism. Both involve matching current observations to prior expectations. The critical difference is calibration. Pattern recognition is calibrated when an expert tracks their outcomes and updates their confidence based on results. Confirmation bias is uncalibrated, maintaining confidence regardless of new data.
The distinction lies entirely in the feedback loop. When you track whether your root cause conclusions actually prevent recurrence over a 12-month horizon, you calibrate your pattern recognition. When you close the 8D and immediately move on to the next fire without checking for recurrence, you feed your confirmation bias. Most manufacturing quality systems structurally enforce the latter behaviour.
You can manage this cognitive blind spot, but only if you design quality processes that assume bias is present. Deming understood this when he placed psychology alongside variation and systems theory in his System of Profound Knowledge. He was highlighting the cognitive realities that dictate how people interpret data and see what they expect to see.
Your confirmation bias is not going away. It is a fundamental feature of human cognition, not a correctable bug. Implementing structural falsification, tracking negative investigation results, and red-teaming your quality reviews are your only mechanical defences. Look at your last three nonconformance reports. Ask yourself what else could have been wrong that you did not look for, and then build a system that forces your team to go look for it.