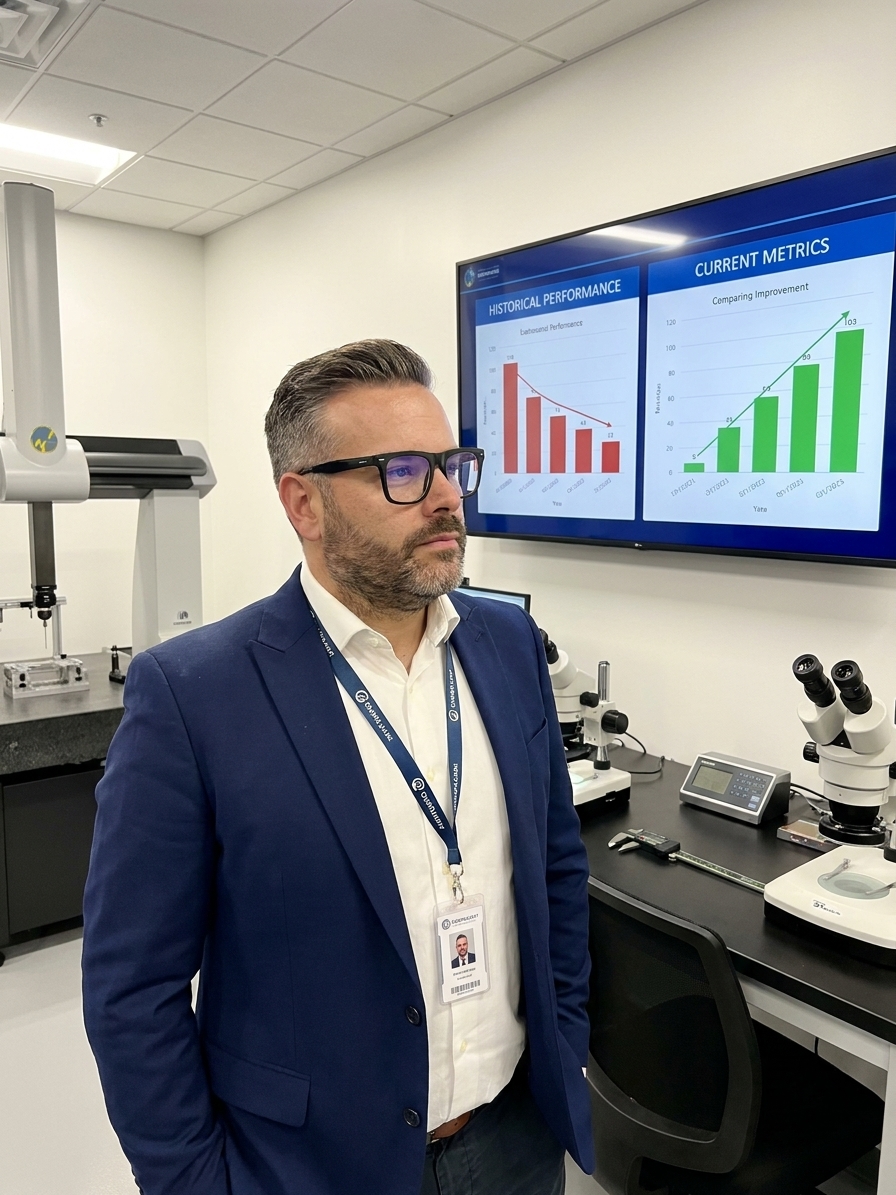
I have audited plants where the leadership team celebrated a scrap rate of 6%. They had spent eighteen months battling a historical baseline of 12%. The industry benchmark was 1.5%, and the customer specification required under 2%. But the plant manager stood up, clapped, and called the team world-class. His reference point was not the customer requirement; it was the misery of the previous quarter.
This is the Contrast Effect in action. It is a cognitive bias where perception of current performance is distorted by what was experienced immediately prior. A 6% defect rate looks like a triumph when you have been staring at 12% for a year. The mechanism is natural, but in quality management, it is dangerous.
Quality data is always relative. A defect rate of 500 PPM means nothing without context. It looks like success against a historical average of 5,000 PPM, but it looks like failure against an average of 50 PPM. Every metric we review is interpreted through a comparison, and every comparison invites the Contrast Effect to distort our engineering judgement.
How the Contrast Effect Distorts Quality Data
The bias works in both directions and makes mediocre performance look outstanding. Organisations do not transition from chaos to IATF 16949 compliance overnight. Improvement happens in increments, and each increment feels less dramatic. The first 30% reduction in non-conformances generates celebration. The next 5% generates a yawn, even if the absolute level of quality is still failing the PPAP requirements.
The inverse is also true. When an organisation has been excellent for a long time, any dip feels catastrophic. Scrap rate moves from 0.8% to 1.2%, and the reaction is entirely disproportionate to the magnitude. The team has been operating at such a high level that the contrast with even minor regression creates panic.
This triggers overreactions to normal variation. Plants launch full-scale 8D investigations into statistical noise. They burn out their best engineers chasing phantom declines that sit well within normal process control limits. The Contrast Effect makes a standard fluctuation look like a systemic collapse because the baseline is so consistently high.

The Improvement Illusion in Practice
The most expensive failure mode is the improvement illusion. An organisation improves significantly from a terrible baseline, and the contrast makes the improvement feel like arrival. The presentation to senior leadership highlights the delta and quietly ignores the destination. The team celebrates progress while remaining nowhere near the required specification.
I have seen facilities spend years trapped in this pattern. They improve from catastrophic to mediocre and then plateau. They stop pushing for Cpk improvements because the contrast with their difficult past makes the present feel sufficient. Good enough, compared to how bad things used to be, replaces the drive for actual target achievement.
The dangerous part is that this feels exactly like a success story. The data shows improvement. The trend lines point upward. The team is motivated and feels momentum. Challenging this narrative feels destructive, but accepting it guarantees you remain uncompetitive in the market. You are measuring the distance travelled, not the distance remaining.
Benchmark Blindness and Peer Selection
Organisations do not just compare themselves to their own past; they compare themselves to the wrong peers. A mid-tier automotive supplier benchmarks itself against other mid-tier suppliers and concludes it operates in the top quartile. The assessment is mathematically correct within that chosen reference group.
However, the OEM customer is benchmarking that supplier against the best Tier 1 in the portfolio. The contrast between what the supplier thinks 'good' looks like and what the customer requires is the gap that eventually destroys the commercial relationship. You pick your comparison set, and that set determines your definition of success.
Anchoring Quality to the Customer Requirement
Building Contrast-Resistant Quality Systems
You cannot eliminate human cognitive bias, but you can design management systems that compensate for it. The most powerful antidote is a relentless focus on customer requirements as the primary anchor. Not last quarter's performance. Not the industry average. The customer's explicit PPAP or contractual specification is the only valid baseline for judging quality.
This requires changing how you present quality data in operational reviews. Stop leading with the trend. Lead with the absolute gap. 'We have improved 40% year over year' is a contextual footnote. 'We are still 2.3 percentage points above the maximum customer rejection threshold' is the headline that drives correct action.
External benchmarks must be aggressive. Internal benchmarks are the Contrast Effect's best friend; they keep you comparing yourself to yourself. Real benchmarking means seeking out the best performers in the industry, understanding their standard work and OEE metrics, and being honest about the operational gap that separates you.
You can be improving rapidly and still be failing the specification. You can be excellent and declining slowly. Both statements require simultaneous acknowledgement.
Separating Trend Assessment From Level Assessment
When evaluating performance, deliberately separate two questions: 'Are we improving?' and 'Are we good enough?' These are completely different assessments, and the Contrast Effect naturally muddles them. The trend question asks about direction. The level question asks about absolute position against the target.
Every layer of governance, from the Gemba walk to the board review, must address both dimensions explicitly. If you only review the trend, a failing process undergoing rapid improvement looks like a victory. If you only review the absolute level, a high-performing process suffering normal variation looks like a crisis. You need both vectors to understand reality.
Corrective Action Review Protocol
- 01Verify Process StabilityConfirm the data is in statistical control before assessing performance level.
- 02Assess Absolute LevelCompare the current Cpk and yield directly against the customer requirement.
- 03Analyse the TrendEvaluate the trajectory to ensure the rate of improvement will close the gap in time.
- 04Determine Resource AllocationApply 8D and engineering resources based on the target gap, not the historical contrast.
Rotating Perspectives and Setting Leadership Anchors
Bring in fresh eyes systematically. Outsiders are not smarter, but they bring a different reference point that reveals distortions. Rotate quality managers between facilities. Invite customer representatives to participate in internal audits. Conduct cross-functional VDA 6.3 process audits where engineering and supply chain evaluate quality together.
Acknowledge human psychology. Celebrate improvement and give the team credit for how far they have come. People need to feel momentum to sustain effort. But ground that celebration in absolute terms every single time. 'We reduced scrap by 50%, and we are still 3x above the customer target. Great progress, critical work ahead.'
The Contrast Effect is fundamentally a leadership challenge. It is the leader's job to set and maintain the right reference points. If leadership celebrates a 6% scrap rate because it used to be 12%, the plant will anchor to that contrast and stop improving. The best leaders hold two reference points simultaneously: they honour the journey, but they communicate the absolute gap with absolute clarity.