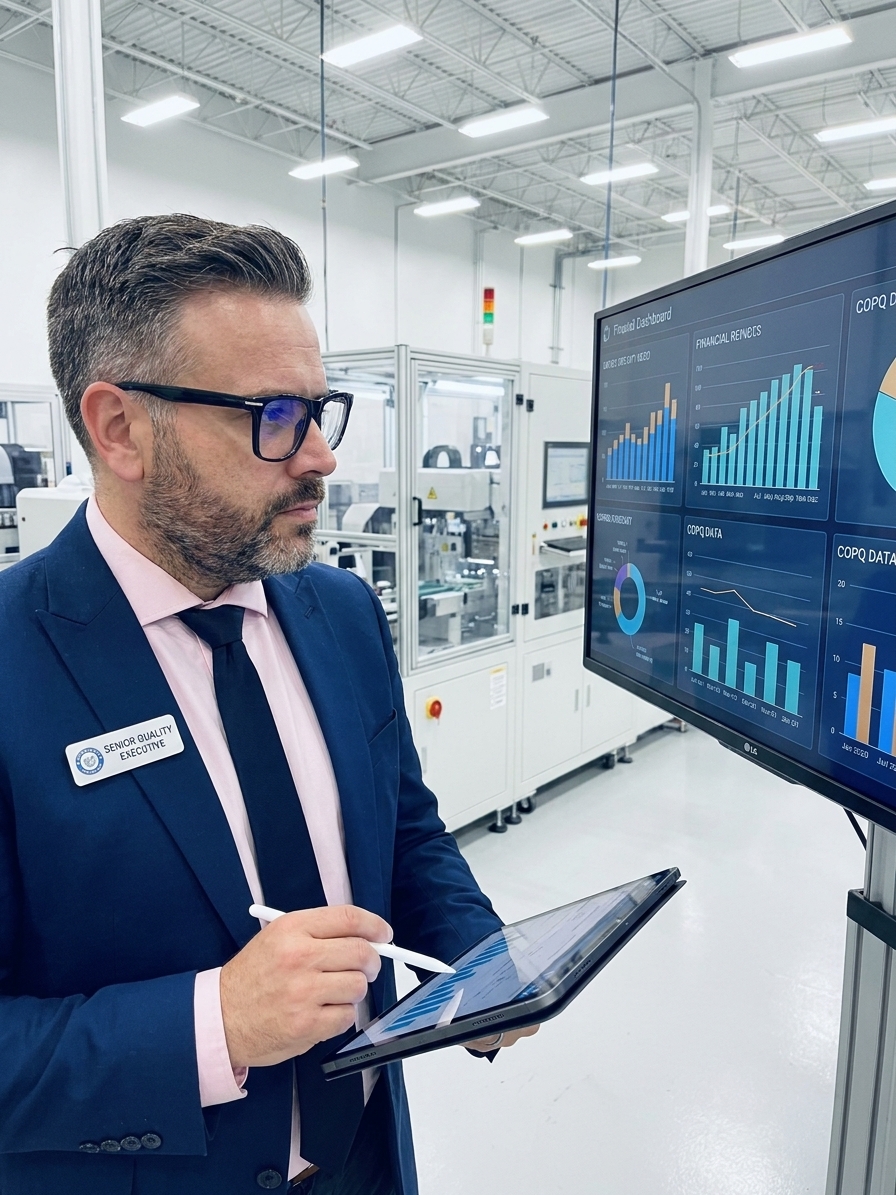
At an automotive supplier several years ago, a customer letter arrived with a €2.3 million chargeback for twelve batches of dimensional non-conformances caught at incoming inspection. No defective parts reached the assembly line. No recall was triggered. The invoice included sorting, line-down penalties, expedited freight, and engineering resources diverted to root cause analysis.
The supplier's quality manager recognized that this single customer claim was more than double the annual budget of his entire department — inspectors, engineers, auditors, calibration, and training combined. That evening, he calculated the true Cost of Poor Quality (COPQ) across the business: internal scrap, recovery overtime, lost quotes, and customers who had quietly moved volume elsewhere. The total was €4.7 million over eighteen months, roughly 12% of annual revenue, at a company that believed it was running efficiently.
I have run this same calculation with over forty organisations. The pattern is always the same: the visible chargebacks and scrap reports represent a fraction of actual failure costs. The rest is buried in logistics budgets, coded as standard production overhead, or hidden in plain sight as Saturday overtime that exists only because the line scraps too much during the week.
The Four Categories That Determine Your Quality Budget
Philip Crosby popularised the COPQ framework in Quality Is Free, building on Armand Feigenbaum's earlier categorisation. The model divides quality costs into four buckets: prevention, appraisal, internal failure, and external failure. Most plants track the first two because they appear in the quality department's budget. The last two — the failure costs — are scattered across the organisation.
Prevention covers what you spend before production: training, PFMEA, APQP, supplier evaluation, calibration, error-proofing. Appraisal covers detection during and after production: incoming inspection, SPC, final testing, audits. Both are visible, budgeted, and controlled. Internal failure is the cost of catching your own defects: scrap, rework, re-inspection, downtime, sorting. External failure is the cost when the customer catches them: warranty, returns, chargebacks, lost business.
The governing principle is straightforward. Increasing prevention and appraisal spend decreases internal and external failure costs, and the decrease is always larger than the increase. In my experience, no organisation is over-investing in prevention. Every plant I have audited operates on the steep left side of the curve, where small prevention investments yield failure reductions of 3:1, 5:1, or higher.
Industry benchmarking consistently places total COPQ at organisations with immature quality systems between 15% and 25% of revenue. World-class operations — those with mature IATF 16949 or AS9100 systems — run at 2% to 5%. The gap between 20% and 3% is not incremental improvement. It is the difference between competitive viability and quiet insolvency.
Why Standard Cost Accounting Hides the Damage
The primary reason COPQ remains invisible is structural. Standard cost accounting systems are designed to track production efficiency, not quality failures. Scrap is charged to the production order. Rework labour is coded to the work centre. Warranty costs sit in a customer service budget. Expedited freight for replacement shipments lands in logistics. None of these roll up into a line item called 'Cost of Poor Quality' on any financial statement.
The normalisation problem compounds the accounting problem. When a plant has operated with a 5% scrap rate for three years, that rate stops being a failure indicator and becomes a planning parameter. The rework cell becomes a permanent department. The Saturday recovery shift becomes standard capacity. Organisations adapt to poor quality the way a person adapts to a slow roof leak — they position buckets and forget the roof is supposed to keep water out.
Ownership is the third barrier. The quality department tracks defect rates, not financial impact. Finance tracks costs, not root causes. Production tracks output volume, not the hidden factory of rework running in parallel. Sales tracks won revenue, not the revenue lost when customers quietly redirect volume. COPQ falls between every functional boundary, which means it becomes nobody's priority.
The Hidden Costs Below the Waterline
External failure costs are visible because they arrive as formal complaints, chargebacks, or warranty claims. Finance tracks them. Management reviews them. They are painful and motivating. But they represent only the tip of the iceberg. The largest costs sit below the waterline, distributed across budgets where nobody recognises them as quality-driven.
Visible vs Hidden Quality Costs
What teams track
- Customer complaints and chargebacks
- Warranty claims and returns
- Scrap reports (in pieces, not currency)
- Formal 8D corrective action costs
What actually drains margin
- Recovery overtime normalised as capacity
- Expedited freight buried in logistics
- Engineering time diverted from NPI to firefighting
- Lost quotes from customers who stopped asking
Internal failure costs are the largest hidden category. Rework hours appear on timesheets but are coded to production orders. Sorting operations are treated as standard procedure rather than quality failure. Downtime is logged under maintenance or changeover, masking the fact that the line stopped because non-conforming material was detected downstream. The opportunity cost of capacity consumed by rework — machine hours that could have produced saleable product — is never calculated at all.
Then there are costs that resist precise quantification but are undeniably real: employee turnover among quality and production staff exhausted by firefighting, insurance premium increases following quality incidents, regulatory remediation costs, and management attention diverted from strategic growth to crisis management. These costs are felt on the floor but never appear in a COPQ report.
The Two-Hour Exercise That Changes the Conversation
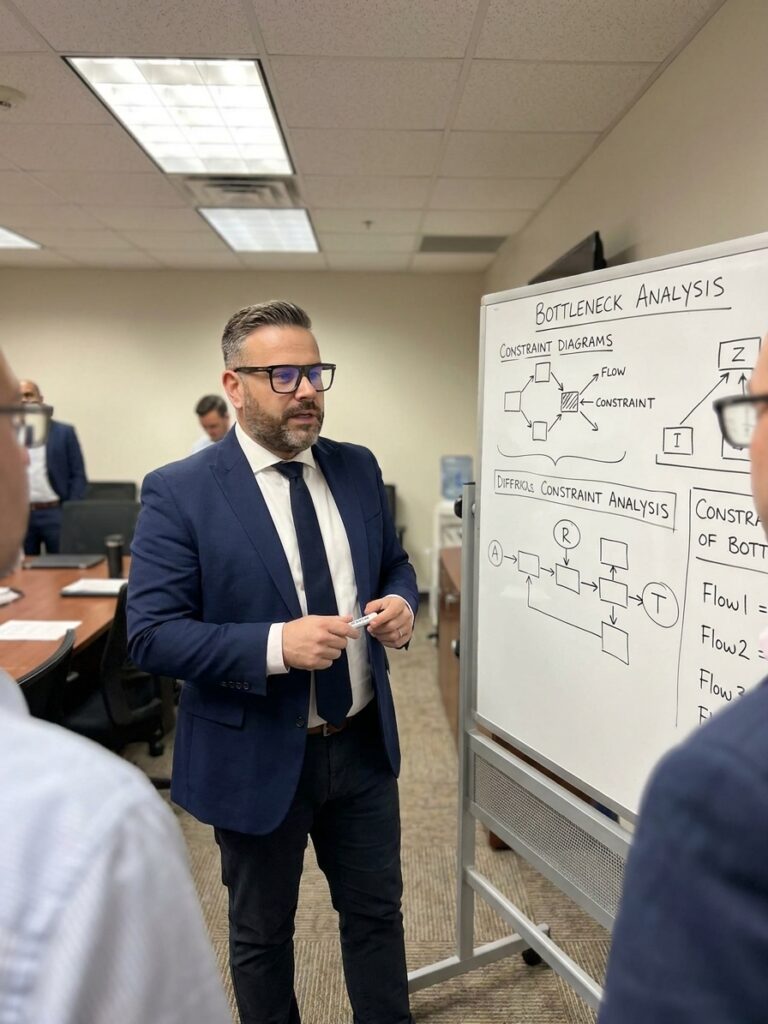
The exercise I run with leadership teams requires two hours, a whiteboard, and index cards. No special software, no consultants, no six-month data collection project. The objective is to establish an order of magnitude — to determine whether the organisation's COPQ is 1% of revenue or 20%. That single number, even as an estimate, reframes every subsequent quality discussion.
Leadership COPQ Quick-Scan Method
- 01External failuresCount complaints, warranty claims, returns, chargebacks, and lost customers with estimated annual revenue.
- 02Internal failuresQuantify scrap in currency, rework hours at loaded labour rates, re-inspection time, and quality-driven downtime.
- 03Hidden overheadAdd recovery overtime, expedited freight, engineering diversion, sorting operations, and customer visit costs.
- 04Opportunity costEstimate lost quotes, capacity consumed by rework, and time-to-market delays. Label clearly as estimates.
Start with external costs — customer complaints, warranty claims, returns, field failures. Most teams move through these quickly. The numbers are uncomfortable but familiar. The shock comes with internal failures. The scrap figure is always larger than anyone expected. The rework hours are always higher. Then someone mentions the Saturday shifts that have run for months because the line cannot produce enough good parts in a regular five-day week.
At one session, an operations director went silent when he realised that 20% of his factory's operating hours — every Saturday for two years — existed entirely because of poor quality. The overtime cost alone was €780,000 per year. He had always treated it as a capacity problem. It was a quality problem wearing a capacity label.
I have watched CFOs physically push back from the table when the total is summed. Not because the number is wrong — because it is right, and because it has been sitting in their financial statements the entire time, camouflaged as production cost, logistics expense, and overhead. The COPQ calculation does not create new costs. It makes existing costs legible.
Building a Measurement System That Drives Action
A workable COPQ framework does not require a perfect accounting system. It requires a good-enough system that captures the major cost categories and makes the invisible visible. The goal is directional accuracy, not decimal-point precision. An estimated cost that is directionally correct is infinitely more useful than no cost data at all.
The optimum prevention point is not theoretical. In thirty years, I have never found an organisation that was over-investing in prevention.
Level 1 is a one-week quick scan: identify the top five external failure costs and top five internal failure costs using existing data. Use ranges, not precise figures. The goal is to determine whether COPQ is 2% of revenue or 15%. That order of magnitude alone shifts the conversation from 'how much does quality cost?' to 'how much is poor quality costing us?'
Level 2 maps the hidden factory through activity-based costing: overtime attributable to quality, engineering time on 8D corrective actions, expedited freight, sorting operations, customer credits and concessions. This requires interviews with department heads, not new IT systems. Level 3 estimates opportunity costs — lost customers, lost quotes, capacity consumed by rework, employee turnover in quality-critical roles. Level 4 tracks prevention ROI: for each major investment in error-proofing, training, or supplier development, measure the failure cost reduction achieved.
This last step closes the loop. It converts quality spend from a cost centre into an investment with measurable returns. When the leadership team sees that €200,000 in automated inspection eliminated €600,000 in annual scrap and chargebacks, the next capital request does not require a six-month justification cycle.
The Payoff: What Changes When COPQ Becomes Visible
The Slovak supplier's CEO called an emergency meeting the morning he received the note. He put the €4.7 million number on the screen and asked one question: if we could cut this in half, what would we do with €2.35 million? The CFO wanted the deferred production line. The sales director wanted to win back lost customers. The operations director wanted to stop the Saturday overtime.
The CEO allocated €800,000 to a targeted quality programme — more than the quality department had ever received. The investments were specific: automated inspection at three critical operations, supplier development for the five worst-performing sources, a redesigned process for the operation driving most dimensional non-conformances, and operator training across all shifts.
Within twelve months, COPQ dropped from €4.7 million to €2.1 million. Within eighteen months, it fell below €1 million. The customer who had sent the €2.3 million chargeback letter renewed their contract for five years. Two customers who had quietly moved their volume came back. The quality manager was promoted to Director of Operational Excellence.
His first act was to make COPQ a standing item on the monthly leadership review, positioned alongside revenue and EBITDA. The number that tells the truth is not a statistical method or a software platform. It is a figure, expressed in currency, that shows exactly how much the organisation is spending on things it should never have had to do.