When I ask plant managers what quality costs their operation, they almost invariably cite the quality department's annual budget. They add up QA and QC headcount, gauge calibration, and audit fees, then present that sum as their cost of quality. This fundamental misconception leaves millions in hidden operational waste unaddressed.
The budget of your quality department represents your Appraisal and Prevention costs. These are the visible costs of maintaining the system. The true Cost of Quality (COQ) encompasses far more: it includes all internal and external failure costs absorbed by the wider manufacturing operation.
Industry analysis consistently shows that for the average manufacturer, COQ consumes 15 to 20 per cent of total revenue. The visible quality department budget is merely the tip of this iceberg. The submerged majority consists of scrap, rework, warranty claims, and expedited freight — costs that sit scattered across production, logistics, and service budgets where nobody aggregates them.
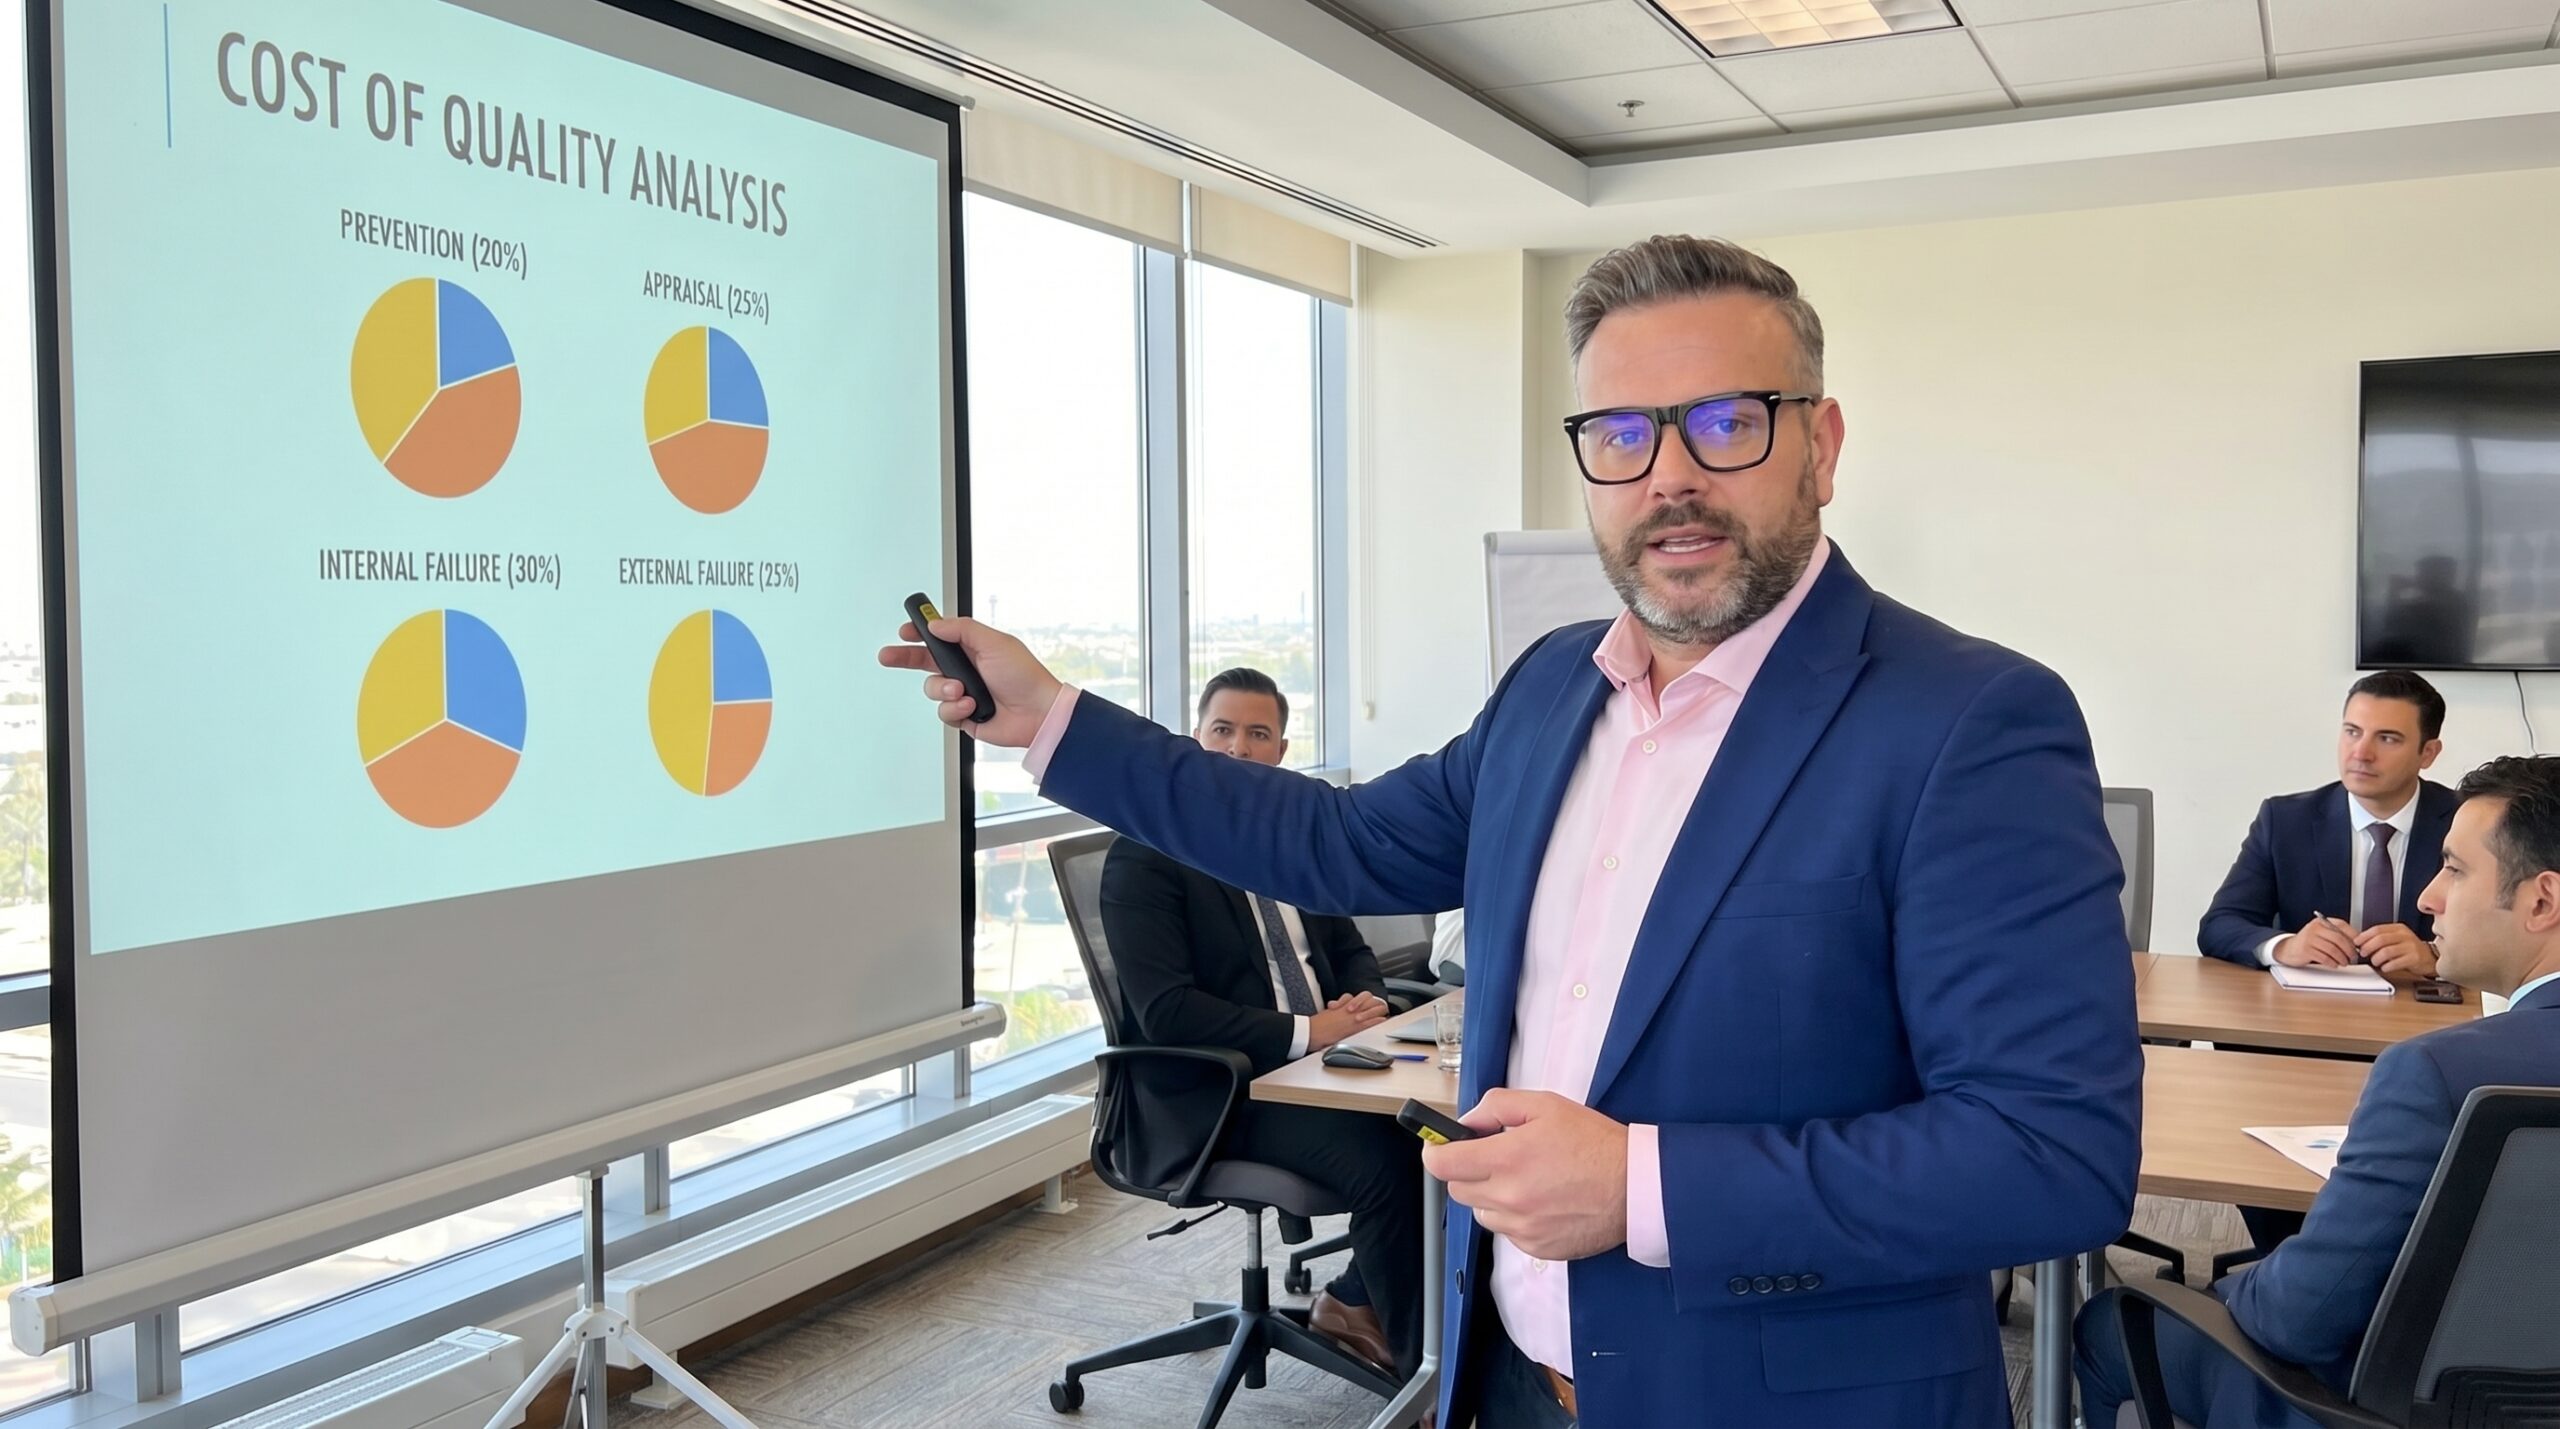
The PAFF Model: Four Categories of Quality Cost
Standardising the COQ conversation requires a strict, universally understood framework. The Prevention, Appraisal, Internal Failure, External Failure (PAFF) model divides quality-related expenditures into four distinct categories. This separation prevents the common error of lumping productive quality investments together with destructive manufacturing waste.
Prevention and Appraisal are conformance costs — the price you pay to ensure things are done right the first time. Internal and External Failure are non-conformance costs — the financial penalty of getting things wrong. A healthy organisation heavily weights its spending toward the former, systematically starving the latter.
In a facility with an unoptimised quality system, Failure costs typically dwarf Prevention costs by a ratio of three or four to one. This imbalance is the root cause of high overall COQ. Managers who cut Prevention budgets to save money inevitably trigger a multiplier effect in Failure costs down the line.
Deconstructing Conformance: Prevention and Appraisal
Prevention costs are targeted investments designed to stop defects before they occur. In automotive and aerospace manufacturing, this encompasses APQP activities, PFMEA development, Poka-Yoke process design, and supplier qualification. These activities require engineering time and upfront capital, which makes them an easy target during budget cuts.
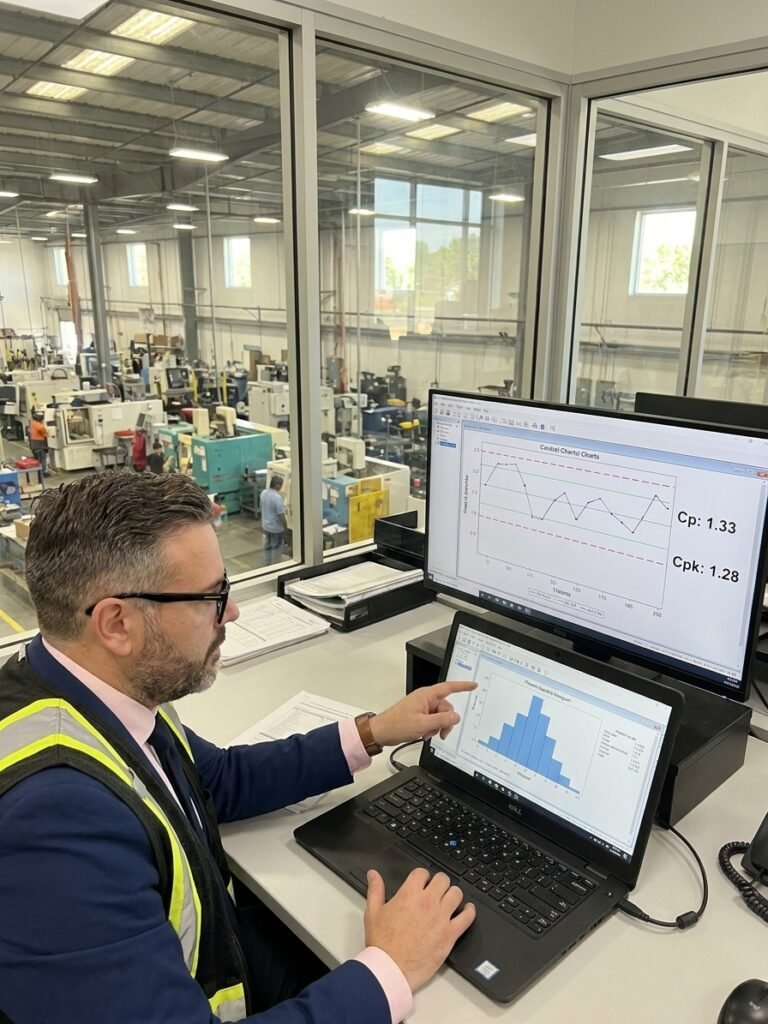
Appraisal costs cover the systematic detection of defects. Incoming inspection, in-process sorting, laboratory material testing, and final mechanical verification fall here. MSA (Measurement Systems Analysis) and gauge calibration are also appraisal activities, ensuring your detection methods themselves are statistically capable of catching non-conformance.
A heavy reliance on Appraisal is often a symptom of weak Prevention. If you have 20 operators running 100 per cent sorting on a press line, your Appraisal costs are exceptionally high because your Prevention design failed. The goal is not to eliminate Appraisal entirely, as IATF 16949 and AS9100 still require verification, but to reduce the volume of inspection needed.
The High Cost of Non-Conformance and Failure
Internal failure costs are generated when a defect is caught inside your facility before shipment. This includes scrap material, direct labour wasted on defective parts, rework hours, and machine downtime caused by quality stoppages. The standard 8D problem-solving process is initiated here, adding engineering man-hours to the cost of the initial defect.
External failure costs occur when a defective product escapes your facility and reaches the customer. In the aerospace sector, a single non-conforming fastener or structural bracket can trigger a massive quarantine effort across the supply chain. In automotive, external failures manifest as warranty claims, field recalls, and line-down penalties charged back by the OEM.
External failure carries the highest multiplier of any COQ category. The cost of a defective component rises exponentially as it moves downstream. A machined part scrapped at the CNC machine costs the raw material price; the same part failing at the OEM assembly plant incurs expedited freight, containment, and contractual penalties.
COQ as a Percentage of Revenue
Calculating and Aggregating Hidden Costs
Implementing COQ measurement requires pulling data from disparate silos. Finance holds the warranty accruals and scrap write-offs. Production logs hold the OEE (Overall Equipment Effectiveness) data degraded by quality stops. Human Resources holds the rework labour hours. Without a deliberate aggregation effort, these costs remain invisible on the P&L statement.
The initial calculation is often an uncomfortable exercise. I have audited plants where the aggregated COQ exceeded 25 per cent of total revenue. When leadership sees that a quarter of their gross income is consumed by scrap, sorting, and warranty penalties, the mandate to invest in prevention becomes immediate and urgent.
Standard practice dictates expressing COQ as a percentage of revenue rather than an absolute number. An absolute number fluctuates with sales volume, masking systemic improvements or degradations. The percentage metric provides a normalised baseline that allows leadership to track the true trajectory of quality system maturity over a multi-year horizon.
The Strategic Shift to Prevention
Reducing total COQ is a counter-intuitive exercise for traditional finance departments because it requires intentionally increasing certain costs. You must deliberately increase Prevention spending to purchase training, engineering time, and better equipment. This temporarily inflates the visible quality budget to collapse the hidden failure budget.
Managers who cut prevention budgets to save money inevitably trigger a multiplier effect in failure costs.
Begin by mapping your current PAFF distribution. If your internal and external failure costs exceed 50 per cent of your total COQ — which is common — your system is purely reactive. You are paying for failure and calling it a cost of doing business. The strategic objective is to shift that ratio so conformance activities dominate.
The Cost of Quality Reduction Cycle
- 01Aggregate COQ dataCompile all Prevention, Appraisal, Internal Failure, and External Failure costs.
- 02Identify failure driversIsolate the top three internal or external failure categories consuming cash.
- 03Invest in preventionFund targeted engineering, PFMEA updates, or Poka-Yoke to address the drivers.
- 04Reduce appraisal loadAs defects drop, safely remove redundant sorting and inspection steps.
- 05Measure and iterateTrack the new COQ percentage and reinvest savings into the next bottleneck.
Realising the Return on Investment
The financial return on prevention investments is measurable and substantial. For every dollar redirected toward upstream engineering — such as refining a PFMEA or implementing robust Poka-Yoke on an assembly line — manufacturers typically remove five to ten dollars from downstream failure costs. This ratio holds true across both automotive and aerospace supply chains.
As failure costs drop, the need for heavy Appraisal diminishes. A process with a proven Cpk (Process Capability Index) of 1.67 does not require 100 per cent final inspection. Eliminating this sorting labour directly improves factory throughput and reduces lead times, compounding the financial benefit beyond pure scrap reduction.
Quality is not a cost centre; it is an operational lever. When you systematically expose your hidden failure costs and restructure your investment toward prevention, you transform the quality function from a financial burden into a driver of manufacturing margin. The data is already in your plant; it simply needs to be calculated and acted upon.