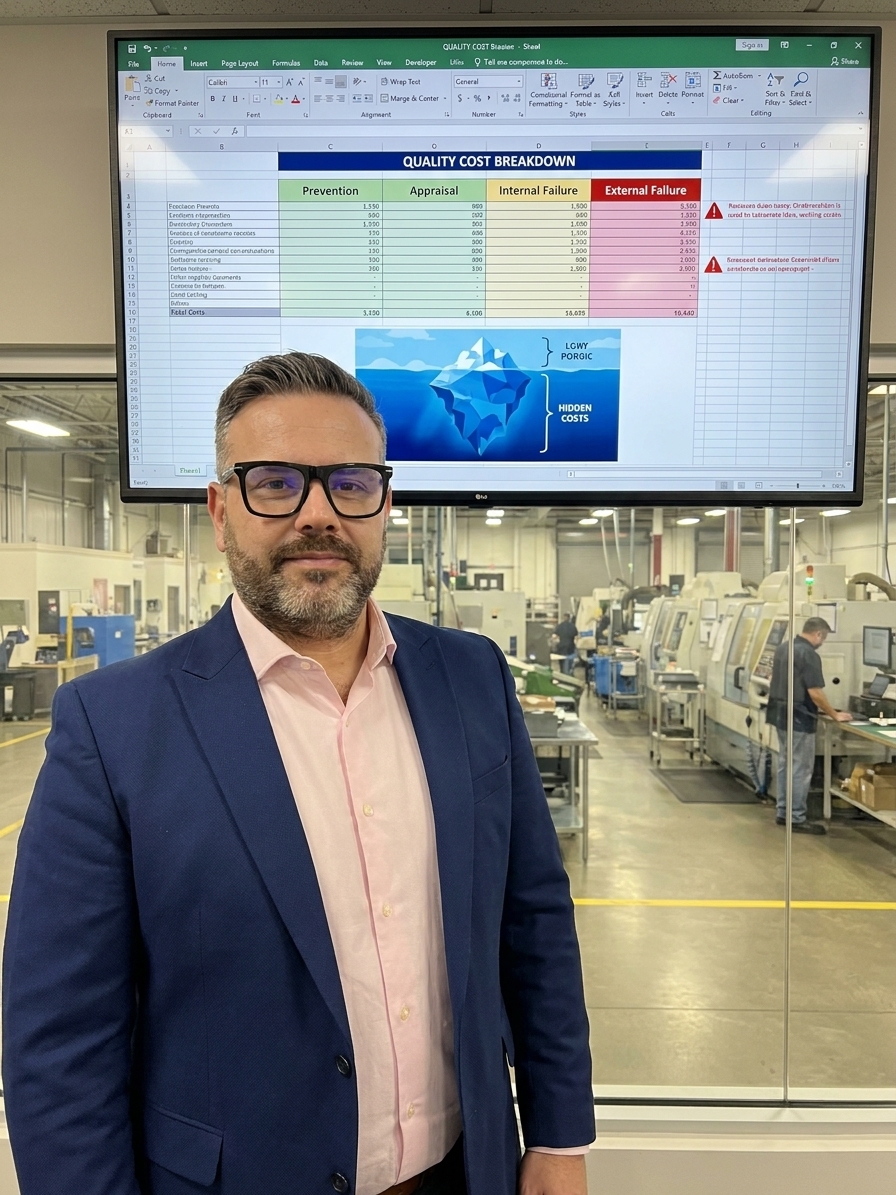
Every quality leader knows the pitch. You stand in front of the executive team, present the four buckets of Cost of Quality (COQ), and draw the iceberg. You cite the 1-10-100 rule, claiming every dollar spent on prevention saves ten on appraisal and a hundred on failure. Leadership nods, approves the quality budget, and asks you to report COQ quarterly. That is the last time anyone thinks about it.
What happens next is a story told in quality departments across every industry. The COQ model becomes a spreadsheet, and the spreadsheet becomes a quarterly ritual. The quarterly ritual becomes a number nobody understands, presented alongside a hundred other numbers executives also do not understand. The savings you promised never appear in the financial statements because nobody connected the COQ model to the actual decisions that drive quality costs.
You built a measurement system. What you needed was a management system. Having implemented ISO 9001 and IATF 16949 systems across automotive and aerospace plants, I have seen this exact failure mode play out repeatedly. The framework is not broken; the implementation is.
The Four Buckets Everyone Draws and Nobody Uses
Prevention costs are the investments you make to stop defects before they happen: quality planning, training, process design, supplier qualification, PFMEA sessions, mistake-proofing, and calibration programs. These are deliberate, proactive expenditures aimed at building capability into the process. When prevention works, failure never occurs, and appraisal becomes redundant.
Appraisal costs are the costs of checking whether things are right. Lab analysis, testing, audits, and inspection add no value to the product itself. Every dollar spent on appraisal is a dollar spent admitting your process is not capable enough to trust. In a mature manufacturing environment, high appraisal costs are a symptom of process weakness, not a sign of quality control.
Internal failure costs are the defects you catch before they leave the building. Scrap, rework, re-inspection, downtime from quality issues, and engineering change orders triggered by nonconformities. Internal failure is expensive but contained. External failure costs are defects that reach the customer: warranty claims, field service, recalls, and regulatory penalties.
The theory says you should shift spending from the right side to the left. Spend a dollar on prevention, save on appraisal, and eliminate failure. The optimal COQ is not zero. It is the point where an additional dollar of prevention spending saves less than a dollar of failure cost. This is sound, well-established theory. It is also almost universally misapplied in practice.
Failure Mode 1: The Accounting Trap
The first thing that happens when you build a COQ model is that finance takes ownership. Prevention costs become training expenses in the HR budget. Appraisal costs become quality operations in the plant budget. Internal failure becomes manufacturing cost variance. External failure disappears entirely because warranty costs sit in after-sales, recalls sit in legal, and lost customers do not show up on any line item at all.
Within a quarter, your COQ model has been dismembered and scattered across six departments. Nobody owns the total number. Nobody can tell you whether it went up or down, or why. The quarterly report becomes an exercise in collecting data from people who do not want to provide it, assembling it into a number that has no actionable meaning.

The model did not fail because it was wrong. It failed because it was handed to accountants instead of operators. Cost of Quality is a management framework, not an accounting framework. The moment it becomes a bookkeeping exercise—a way to categorize spending after the fact rather than a tool for deciding where to invest before the fact—it is dead.
Failure Mode 2: The Prevention Paradox
You launch your COQ program and invest heavily in prevention: training, mistake-proofing, and tighter supplier qualification under PPAP requirements. For the first two quarters, your total COQ goes up. You are spending more on prevention while failure costs have not yet come down. The improvements take time to materialize through the manufacturing system.
The CFO looks at the trend and sees quality costing more money. Here is the paradox: the better your prevention program works, the less visible the failures it prevents become. When your defect rate drops, scrap bins empty, rework stations go idle, and warranty claims dry up. Everyone can see the prevention costs. Nobody can see the failures that did not happen.
A problem that does not occur cannot be measured, cannot be reported, and cannot be credited to the prevention program that stopped it. So the CFO cuts the prevention budget. Within six months, the defect rate creeps back up, scrap bins fill, and warranty claims return. A new quality leader is hired to fix the problem, starting naturally with a new COQ model. This cycle is structural.
Reporting vs. Managing Cost of Quality
The Reporting Trap
- Categorizes spending after the fact across disparate ledgers
- Reports a single aggregate metric on a quarterly lag
- Owned by finance and disconnected from plant floor realities
- Cannot quantify the cost of failures that never happened
The Management Tool
- Ties prevention investment directly to specific defect reduction
- Updated continuously as scrap, rework, and warranty data flow in
- Owned by operations leadership driving process capability (Cpk)
- Models the risk-adjusted return of avoiding external escapes
Failure Mode 3: The External Failure Blind Spot
Most COQ models do a reasonable job of capturing prevention, appraisal, and internal failure costs. These are visible, internal, and traceable. You can count the scrap bins, total the inspection hours, and price the rework. External failure is different. A warranty claim involves logistics, field service technicians, customer service time, expedited shipping, and lost orders.
The largest cost of external failure—reputational damage and lost future business—is essentially unmeasurable, and therefore absent from almost every COQ model ever built. This distorts decision-making. When you under-count external failure, you systematically under-invest in prevention. The model tells you quality costs are 3 percent of revenue when the real number might be 8 or 12 percent.
You make investment decisions based on the lower number, approve projects that look marginal, and reject the prevention programs that would have saved the most money. The iceberg metaphor is exactly right. You see the tip. The massive block of ice below the surface—lost customers, damaged reputation, regulatory risk—is invisible. Because it is invisible, it does not drive decisions.
The accounting system records what you spend. It cannot record what you avoided spending.
The 1-10-100 Rule: Misleading in Practice
The famous 1-10-100 rule says a defect costs one dollar to prevent, ten dollars to detect, and a hundred dollars to fix after it reaches the customer. It is a useful heuristic for explaining why prevention is cheaper than detection and failure. But it has been so oversimplified that it has lost its operational value.
The rule was never meant to be a literal ratio. It was a metaphor for the exponential growth of quality costs as a defect moves downstream. The actual ratios vary enormously by industry, product complexity, and regulatory environment. In high-volume consumer goods, the prevention-to-failure ratio can be 1:1000. In regulated industries like aerospace or medical devices, a single external failure can cost thousands of dollars for every dollar of prevention.
Organizations use the generic ratio as a substitute for actual measurement. Instead of building a real COQ model tailored to their cost structure, they apply a heuristic and assume the numbers will work out. The ratio for a welding defect in an automotive frame is completely different from the ratio for a software bug in a medical device. Treating them the same is not a simplification. It is an error.
Moving Beyond Generic Heuristics
Building a Living COQ Model
A Cost of Quality model that actually drives improvement looks nothing like the quarterly spreadsheet sitting in most quality departments. It is decision-oriented. The purpose of the model is to answer a specific question: if we invest capital in this prevention project, what failure costs will we avoid, and over what time horizon? Every element of the model must support that calculation.
A living model tracks costs by defect type, by process, by product line. Generic COQ categories are useful for education but useless for management. You need to know that weld defects in the chassis line cost a specific amount per quarter, and that a targeted prevention project would reduce that by a measurable percentage. A total COQ number of two million dollars is not actionable. The localized breakdown is.
The model must include near-miss and hidden costs. Quantify what generic models ignore: the cost of expedited shipping when defective parts delay production, the cost of additional inspection when a process is unstable, and the cost of customer complaints that do not result in returns but reduce future orders. These costs are real, significant, and hiding in your operational data.
The model must be owned by operations, not by the quality department. Quality builds and maintains the model, but the cost data comes from operations. Investment decisions are made by operations leadership, and the results show up in operational metrics like OEE. When the COQ model lives only in the quality department, it becomes an advocacy tool. When it lives in operations, it becomes a management tool.
Connecting COQ to the Decisions That Matter
The ultimate test of a Cost of Quality model is simple: has it ever changed a decision? Has a COQ analysis ever caused you to approve a prevention investment you would otherwise have rejected? Has it ever caused you to reject an appraisal program because the numbers showed it cost more than the defects it caught? If the answer is no, your COQ model is dead weight.
Bring the model to life by connecting it to specific, named decisions. At the start of each quarter, identify the quality investment decisions leadership will face: a new inspection technology, a supplier development program, a process redesign. For each one, build a COQ case. Detail what it will cost, what failure costs it will avoid, the payback period, and the risk-adjusted return. Present the model as a decision-support tool.
The COQ Investment Decision Cycle
- 01Identify Local DefectsSelect top three to five defect types by actual cost.
- 02Map the CostTrace actual costs through internal and external failure paths.
- 03Model Prevention ROICalculate specific investment vs. avoided failure cost.
- 04Approve and ExecuteFund the prevention project based on localized data.
- 05Measure the ShiftTrack the drop in failure costs continuously, not quarterly.
This is what Philip Crosby meant when he said quality is free. Prevention costs money. Appraisal costs money. Building quality into processes costs money. What is free is the result: when you invest wisely in prevention, the failure costs you eliminate are far greater than the prevention costs you incur. The net is positive. Quality pays for itself.
But only if you can see the connection. Your model must be good enough to show, specifically and credibly, how a dollar of prevention translates into ten dollars of avoided failure. It requires the courage to estimate the unmeasurable—the lost customer, the damaged reputation, the regulatory risk. And it requires leadership willing to act on the model's conclusions, even when the current quarter's numbers look worse because prevention spending is up.
The Discipline to Sustain Investment
The hardest part of managing quality costs is not measuring them. It is having the discipline to keep investing in prevention when the numbers say you do not need to. Every successful quality program reaches the same moment. Defect rates are low, scrap is minimal, and customer complaints are rare. The COQ model shows prevention spending as the largest component of quality cost.
The logical conclusion—the conclusion every CFO reaches—is to cut prevention spending. This is where quality leaders earn or lose their mandate. The ones who cut prevention watch the gains evaporate within a year. The ones who hold the line, who can explain with data that the low failure rate exists because of the prevention spending, are the ones who sustain quality performance over decades.
Cost of Quality is a leadership philosophy. The costs you can see are smaller than the costs you cannot. The investments that seem expensive are cheaper than the failures they prevent. The moment you stop investing in quality is the moment your quality starts to decline—slowly enough that you will not notice, steadily enough that you will not recover.
The question is not whether your COQ model is accurate. The question is whether your organization has the discipline to act on what the model tells it. Even when acting on it means spending money on problems that do not exist yet, to prevent failures that have not happened, for customers who have not complained.