Quality systems rarely fail because of a single catastrophic event. They fail through a slow, quiet deterioration that everyone lives with and nobody addresses until a customer rejects an entire shipment, or an auditor writes a major nonconformance against IATF 16949 or AS9100. The decline happens one degree at a time, and the organization adapts to each change until the adaptation itself becomes the problem.
I have watched this pattern across automotive assembly lines, aerospace suppliers, and pharmaceutical plants. A calibration interval gets extended because the lab is backed up. A first-article inspection is waived because the part is the same as last time. A scrap rate creeps from 1.2% to 1.8% over three months, and the quality manager notes it but dismisses the change because the target is 2%. Each degree is survivable, explainable, and perfectly reasonable in isolation.
The result is a quality system that looks intact on paper while the actual process has fundamentally degraded. The boiling frog effect does not happen because people are negligent. It happens because human beings are exquisitely tuned to detect sudden changes and remarkably poor at detecting gradual ones. Your organization adjusts to declining standards through the absence of conscious detection, not through conscious acceptance.
How the Water Starts Warming
Quality decline never announces itself with alarm bells or red dashboards. It arrives through small compromises that feel necessary in the moment. A process that used to have three control points now has two because the third was deemed redundant and the engineer who designed it left the company. Nobody remembers why the check existed. The PFMEA was never updated, and the control plan was never revised.
I worked with a Tier 1 automotive supplier that had maintained a customer return rate below 15 PPM for seven consecutive years. When I arrived, their return rate was 340 PPM. They were in crisis mode: the customer had placed them on probation, source inspections were required, and their PPAP submissions were under intense scrutiny. The catastrophe had not happened overnight.
When we reconstructed the timeline, the deterioration had taken eighteen months. The return rate moved from 15 to 22, then to 35, 58, 90, 150, 280, and finally 340. Each increase was discussed in the monthly quality review. Each was explained. Each was supposedly being addressed. But nobody had drawn a line and stated that this was no longer the same quality system they had built a year prior.
The Four Mechanisms of Gradual Decline
After twenty years of implementing and auditing ISO 9001, IATF 16949, and AS9100 systems, I have identified four mechanisms that drive gradual quality decline. The first is threshold drift. Control limits get recalculated using recent data that already includes the deterioration, embedding the decline into the new normal. A specification gets relaxed through a concession that quietly becomes permanent. An action limit gets adjusted because it was triggering too many alerts.
The second mechanism is evidence erosion. A record gets filed late, then incompletely. Then it gets filed from memory at the end of the shift instead of in real time. Eventually the record exists, but the data in it is reconstruction rather than observation. This is how organizations pass external audits while their quality systems are already failing. The auditor checks for records, and the records are present, but they no longer reflect reality.
The third mechanism is attention atrophy. When a process has been running without issues, attention naturally migrates to newer problems. The operator who used to verify every part starts checking every third part. The supervisor who reviewed SPC charts daily moves to a weekly schedule. The manager stops walking the line every morning. None of these shifts is a conscious decision to lower standards, but the process is deteriorating invisibly because nobody is looking.
The fourth mechanism is the normalization of deviance, a term coined by sociologist Diane Vaughan in her analysis of the NASA Challenger disaster. It occurs when deviations from standards become so common that they become the de facto standard. The first time an operator skips a check, it feels wrong. The tenth time, it feels routine. The hundredth time, the written standard feels like an unrealistic ideal. Each unremarked deviation redefines what normal looks like.
Cross-Sectional vs. Longitudinal Quality Monitoring
What teams do
- Compare current month's scrap rate to the 2% target
- Accept Cpk 1.45 because it exceeds the 1.33 minimum
- Review concession logs for the current quarter only
- Treat passing the annual IATF 16949 surveillance audit as proof of system health
What works
- Plot the rolling 12-month trend against historical best performance
- Track Cpk over 24 months to detect mean shift and increasing variation
- Flag every permanent concession as a threshold drift risk
- Audit the actual process floor against the control plan, not just the paperwork
Building the Temperature Gauge
If the fundamental problem is that gradual change is invisible, the solution requires making the invisible visible. You need a temperature gauge: a mechanism that measures absolute quality performance over time, independent of how normal the current state feels. Most quality reporting is cross-sectional. It tells you where you are right now compared to a target. It does not tell you the trajectory.
A longitudinal baseline tracks the same metrics over extended periods. I implement a rolling twelve-month control chart for every critical quality metric, with the baseline period set to the organization's historical best performance. Not the target. Not the industry benchmark. The best the plant has actually achieved. Any sustained departure from that baseline is a signal, regardless of whether the metric remains within specification.
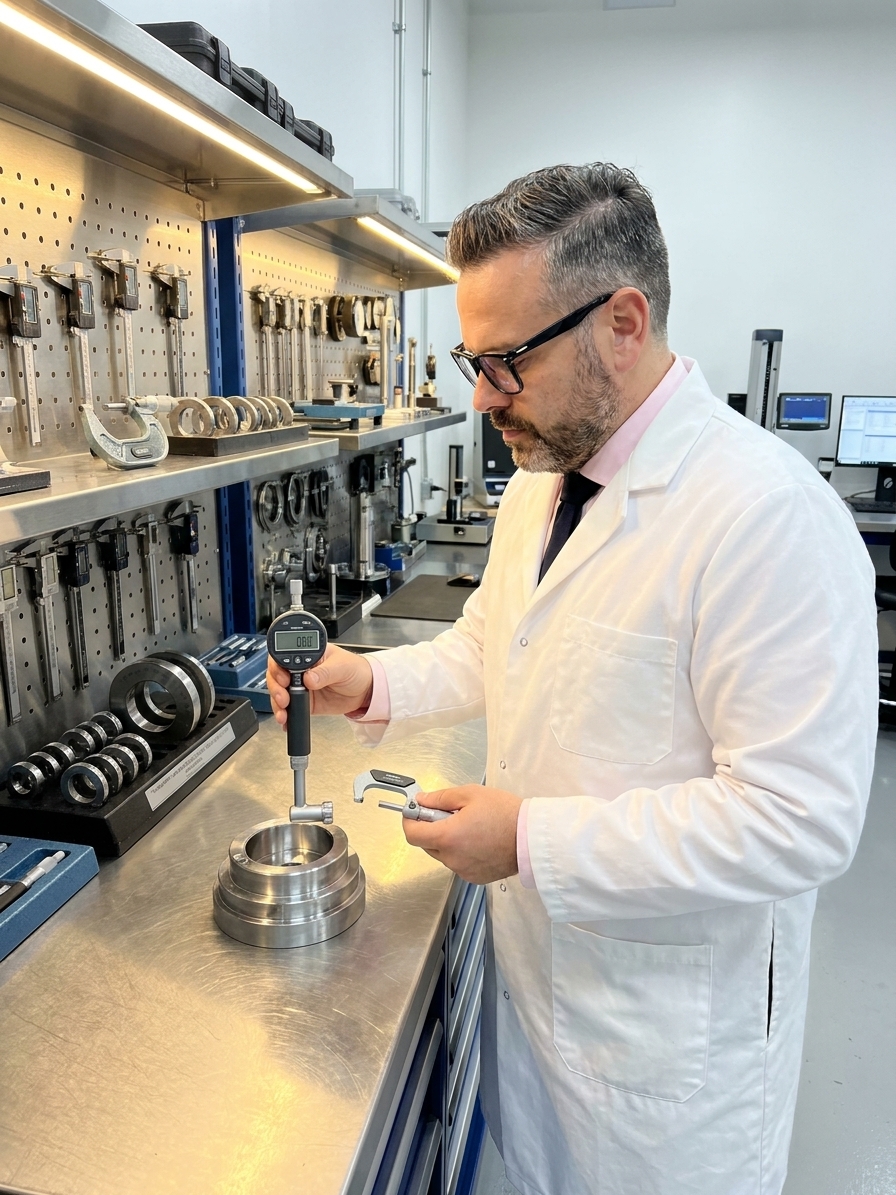
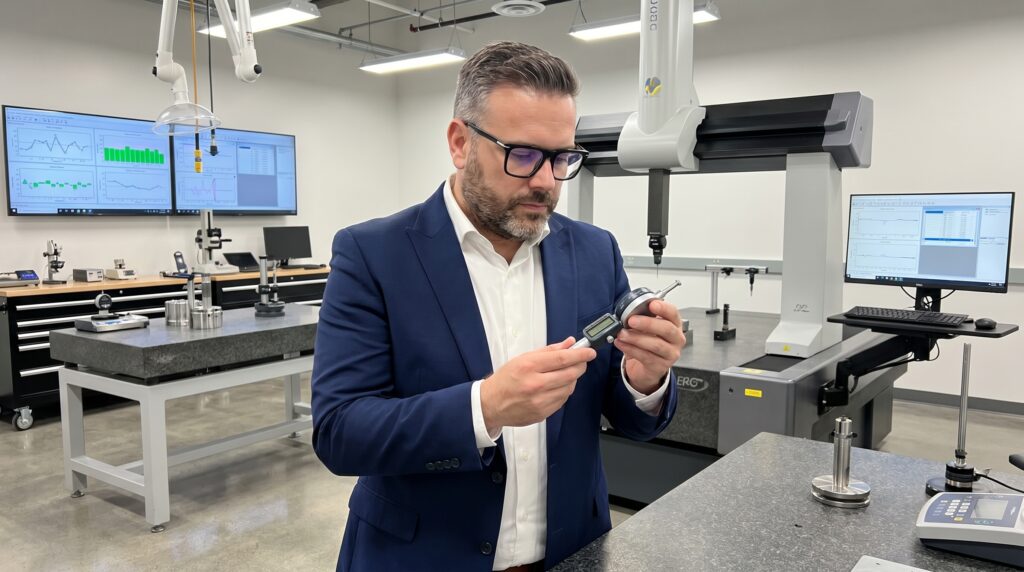
Process capability indices demand the same treatment. Cpk and Cp are typically calculated as current snapshots. But tracking process capability as a time series reveals deterioration that no single calculation can show. I worked with a machining operation whose Cpk on a critical bore diameter was 1.45. The figure was perfectly respectable in isolation, but plotting the monthly Cpk for the previous two years revealed a decline from 1.72.
The mean was shifting and the variation was increasing. The trajectory was clear and the endpoint was mathematically predictable: in another eight months, the process would drop below 1.33, and in fourteen months it would fall under 1.0. Nobody had noticed because a snapshot of 1.45 is fine. But a 1.45 reading after two years of sustained decline is a warning that demands immediate action.
Measuring Cultural and Process Drift
Not all quality deterioration shows up in metrics first. Sometimes it shows up in behavior. Operators stop reporting near-misses. Engineers stop challenging concessions. Supervisors stop asking questions during shift handovers. A quarterly culture pulse, conducted anonymously across everyone who touches the quality system, detects behavioral drift before it registers in the scrap rate or PPM figures.
Key Indicators of Gradual System Decline
The questions are simple. When was the last time you reported a concern? Do the current quality standards reflect what actually happens on the floor? Has any process step been informally modified in the last quarter? Would you feel comfortable raising a quality concern to your manager right now? If confidence in standards is declining, if concern-reporting is dropping, and if informal modifications are increasing, the water is warming.
Saying 'it's still within spec' is not a response to a sustained adverse trend. It is a symptom of the problem.
These cultural indicators function as an early warning system. A rise in informal modifications means the PFMEA and control plan are no longer the governing documents of the production floor. By the time the formal documentation is updated, the actual process has already moved on. The gap between documented and actual practice is where defects are born.
Restoring the Original Standard
When you realize your organization is already in warm water, you cannot fix the problem by turning the temperature down one degree. You have to jump back to cold water. That means restoring the original standards: the original control points, the original inspection frequencies, the original calibration intervals, and the original documentation requirements dictated by your MSA and control plan.
This will feel like overreaction. It will feel like unnecessary cost and a step backwards. That feeling is the normalization of deviance fighting back. The first step is to establish the real baseline. Pull the data from two years ago for every critical metric and lay it next to today's data. The gap between the two is the actual temperature of your water.
The second step is to reconstruct the trajectory. Determine when the decline started and whether it was triggered by a specific event such as a personnel change, a cost reduction initiative, or new customer pressure. The third step is to audit the actual process. Go to the floor, watch the process run, and compare what you see to the work instructions and control plan.
Response Sequence for Reversing Quality Drift
- 01Establish the baselineCompare current critical metrics to historical best performance over a rolling 24-month period.
- 02Reconstruct the trajectoryIdentify when the decline began and map it to personnel changes, cost cuts, or process alterations.
- 03Audit the actual processWalk the floor to verify that documented control plan requirements match the reality of daily operations.
- 04Restore original standardsReinstate bypassed control points, inspection frequencies, and calibration intervals to their original levels.
- 05Install permanent monitoringDeploy longitudinal tracking and cultural pulse surveys to detect the next drift before it compounds.
The gaps you find between documented and actual practice are your degrees of warming. Close them. Finally, install the monitoring systems that will prevent the frog from sitting in warming water again. Implement longitudinal tracking, process capability time series, and regular gemba walks by people with the authority to stop the line and initiate an 8D investigation.
The Leader's Responsibility
The gradual decline of a quality system is fundamentally a leadership failure. It happens not because leaders are negligent, but because leaders are human and adapt to gradual change the same way everyone else does. The leader's job is to be the person who notices the temperature even when everyone else in the plant has adapted to the heat.
This requires the discipline to look at long-term data when short-term data looks acceptable. Every month, review critical metrics on a rolling twelve-month chart. Every quarter, compare current performance to historical best. Every year, reassess whether your standards have drifted from their original intent. If the scrap rate has doubled but remains under target, address it immediately.
Every concession, every waiver, and every temporary exception is a degree of warming. Some are genuinely necessary for production continuity. Most quietly become permanent. Treat every exception as what it is: a risk that must be actively managed through cross-functional review, not a problem that has been solved by a signature. If you do not manage the drift, the drift will manage your quality system.
If you could transport your organization back two years and place it next to your current operation, would the current state be acceptable? Not whether it is within specification, not whether you are passing audits, and not whether customers are complaining. Is this the same quality system you built? Are you holding the same standards? If the honest answer is no, or if you do not know, the water is already warm. Stop adapting and start jumping.