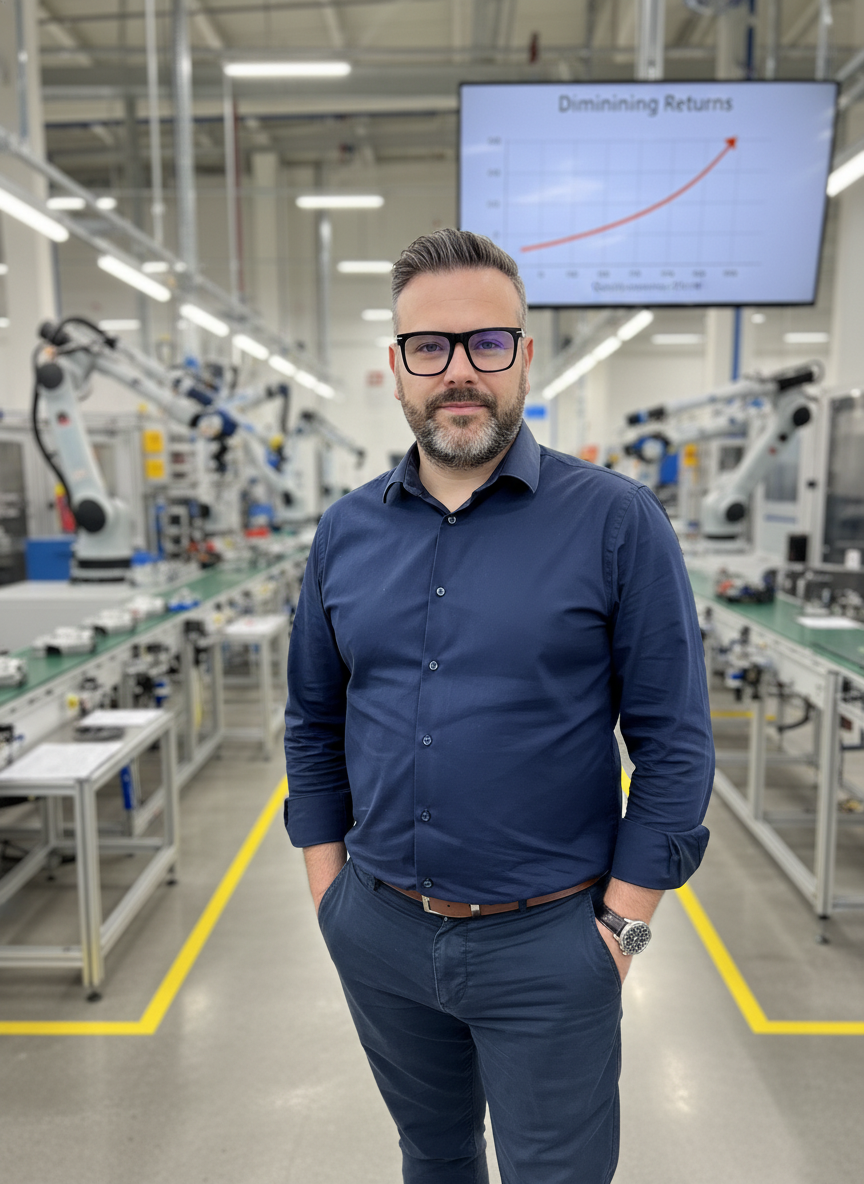
There is a point where every additional dollar spent on quality returns less than a dollar in value. Most organizations never find this inflection point. Some blow past it aggressively, spending themselves into mediocrity while chasing an absolute zero-defect mandate. Others never come close, leaving money on the table in the form of warranty claims, scrap, and lost customers. The organizations that win find the sweet spot and defend it with the same ferocity others reserve for chasing perfection across the board.
This is the law of diminishing returns applied to quality engineering. It is not a failure of ambition or a licence to accept mediocrity. It is a mathematical reality governed by process capability and the cost of tightening tolerance bands. Pretending this curve does not exist is one of the most expensive mistakes a quality director can make. It diverts engineering talent and capital away from high-leverage processes and funnels them into asymptotic chasing of insignificant gains.
Throughout my career implementing ISO 9001 and IATF 16949 systems, I have audited plants that were technically flawless but economically unviable. They achieved staggering capability indices on non-critical characteristics while ignoring systemic failures on the shop floor. Quality excellence is not about pushing every parameter to its mathematical limit. It is about selectively investing where the customer feels the impact and deliberately managing the rest to a state of deliberate, compliant adequacy.
The Mathematics of the Flattening Curve
Every quality professional knows the diminishing returns curve. The x-axis represents investment: time, capital, inspection hours, measurement frequency. The y-axis represents quality output: defect reduction, first-pass yield, warranty cost avoidance. At the left side of the graph, returns are magnificent. You implement basic statistical process control on a high-volume line, and your defect rate plummets. You introduce a simple poka-yoke where the majority of defects originate, and your scrap costs halve overnight.
In this steep phase, every dollar invested returns multiples in value. Standardizing work instructions alone can lift your process capability index from an unpredictable 0.8 to a stable 1.2. The big contributors to variation are easily identified and controlled. But eventually, the curve flattens. You have fixed the obvious problems. Your Cpk sits at a respectable 1.33, well within specification and fully capable of meeting customer requirements. Then an executive attends a conference and issues a mandate for a Cpk of 2.0 across the board.
Achieving that jump from Cpk 1.33 to 2.0 requires tightening your process variation by roughly 25 percent. This does not mean 25 percent more effort. It requires a fundamentally different level of process control. You must replace perfectly functional tooling because it introduces slightly more variation than the new target allows. You must upgrade measurement systems because your current gauge R&R, which was perfectly adequate at Cpk 1.33, now consumes too much of your tolerance budget. You must source tighter raw materials, renegotiate with suppliers, and pay premium prices.
The cost of moving from Cpk 1.33 to 2.0 might be three to five times what it cost to get from zero to 1.33. The defect reduction goes from roughly 6,000 PPM to 0.002 PPM. For the vast majority of industrial applications, the customer will never notice the difference. The warranty claims do not change. But the capital investment was enormous, the lead time increased, and the organization missed the opportunity to fix other failing processes.
The Perfection Trap and Misallocated Risk
I have reviewed quality systems where the cost of achieving extraordinary quality levels actively harmed the business. One manufacturer measured defect rates on a flagship product in parts per billion. They maintained seventeen inspection steps on a single assembly. They operated dedicated clean rooms for processes that did not strictly require them, built years earlier when a conservative engineer specified ISO Class 7 environments just to be safe. They assigned multiple quality engineers full-time to a low-volume product line.
The company was losing money on this product. The cost of achieving this astronomical level of excellence exceeded the revenue the product generated. When this finding was presented, the standard pushback followed: you cannot put a price on safety. But the uncomfortable truth is that every dollar spent over-engineering one product is a dollar unavailable to improve another. This plant had secondary product lines operating with defect rates in the hundreds of PPM, receiving a fraction of the attention.
The net effect on overall risk was profoundly negative. The company's aggregate risk portfolio was worse because of severe resource misallocation. We rebalanced the system. We reduced inspection steps on the flagship from seventeen to nine, remaining well above industry norms and fully compliant with regulatory requirements. We redirected quality engineering resources and invested those savings into the three product lines where the improvement curve was still steep.
Within eighteen months, the company's aggregate quality metrics reached historic highs. The flagship product's defect rate did not change in any measurable way, because we had removed inspection waste, not quality. The neglected lines improved dramatically, reducing the company's total risk exposure by a factor of four. Dedication to quality without economic awareness eventually becomes a mechanism for self-destruction.
Distinguishing the Flat Part from the Starting Line
The concept of diminishing returns is frequently weaponized as an excuse for mediocrity. Organizations invoke it while operating at Cpk 0.9, with scrap rates exceeding three percent, and with corrective actions permanently open. These plants are not experiencing diminishing returns. They are experiencing insufficient investment. The curve has not flattened for them; they simply have not started climbing it. The flat part of the curve only applies when fundamental process control is already established.
You are still on the steep part of the curve if your top three defect categories account for more than 50 percent of your total defects. If you have not performed a formal root cause analysis on your highest-impact failure modes using 8D methodology, you have no right to claim diminishing returns. If your cost of poor quality exceeds three percent of revenue, or if operators can describe quality problems that engineering is oblivious to, your improvement curve is still wide open and highly lucrative.
You are entering the flat part when your defect Pareto is relatively flat, with no dominant contributors remaining. Further process improvements require heavy capital investment with multi-year payback periods. Your measurement system uncertainty begins to consume a significant portion of your tolerance. Improvements require fundamental process redesign rather than standard optimization. At this stage, your engineers spend more time documenting improvements in VDA 6.3 audits than creating them.
Diagnosing Your Position on the Quality Curve
Still on the steep part (Under-investing)
- Top 3 defect modes drive over 50% of total scrap
- Cpk on critical characteristics sits below 1.33
- Cost of poor quality exceeds 3% of total revenue
- Repeat customer complaints remain unresolved quarter over quarter
On the flat part (Over-investing)
- Defect Pareto is flat with no dominant failure modes
- Gauge R&R consumes a disproportionate share of tolerance
- Quality investment doubles with no measurable defect reduction
- Inspection costs exceed scrap and warranty costs combined
Tiered Characteristic Management
Leading automotive manufacturers long ago abandoned the pursuit of zero defects on all characteristics. They classify product characteristics into rigid tiers based on failure mode severity. Safety-critical characteristics demand zero defects. There is no compromise. Cpk targets are set above 2.0, supported by 100 percent inspection or fully error-proofed poka-yoke processes. The investment here is essentially unlimited because the cost of failure is catastrophic.
Function-critical characteristics require competitive excellence. Cpk targets range from 1.33 to 1.67, maintained through statistical process control with appropriate sampling. Continuous improvement is mandated, but applied with strict economic awareness. Appearance and comfort characteristics need only be good enough to satisfy the customer. Cpk targets of 1.0 to 1.33 are entirely sufficient. Standard process control applies, and investment is strictly proportional to customer impact.
Treating all characteristics as safety-critical is a form of manufacturing waste. When an organization concentrates resources on the characteristics that matter most, warranty costs drop significantly. By deliberately downgrading over-engineered Tier 3 characteristics, resources are freed to aggressively attack Tier 1 defect rates. All quality matters, but not all quality matters equally. Applying PFMEA severity rankings correctly dictates where your marginal engineering hour belongs.
Quality is not a religion. It is an economic discipline defined by the ratio of value created to resources consumed.
Establishing the Strategic Quality Budget
Finding the optimal balance requires honest measurement, economic literacy, and the discipline to stop improving processes that are already good enough. Most organizations measure their cost of quality. Fewer measure their return on quality investment. Cost of quality tells you what compliance costs. Return on quality tells you what quality earns. You must track the marginal return on your last three quality improvement projects to understand where you sit on the curve.
If each recent project delivered less value than the previous one, you are subject to diminishing returns. If the most recent project cost more to implement than it saved in the first year, you have passed the sweet spot. The most profitable position is often just above the customer's quality threshold. You must invest just enough that the customer never has a reason to question your reliability, without spending capital on unrequested perfection.
I advise organizations to allocate their quality improvement budget using a strict portfolio strategy. This framework ensures capital flows toward high-leverage opportunities rather than being diluted across static processes. It forces leadership to acknowledge that maintaining the status quo has a cost, and that exploring entirely new manufacturing technologies is a legitimate quality function.
This allocation model prevents the quality department from becoming an isolated priesthood. It embeds financial accountability into the continuous improvement process. When a quality engineer proposes a new project, they must justify it against the marginal return of alternative investments across the plant. This is how quality shifts from a bureaucratic overhead function into a strategic driver of operational profitability.
Strategic Quality Budget Allocation
- 01High-Leverage Improvement (70%)Target the 20% of processes furthest from optimal quality. Returns are steep, and every dollar invested yields multiple dollars in defect reduction.
- 02Sustainment and Maintenance (20%)Fund calibration, training, audit programs, and control plan adherence to prevent backsliding on processes already optimized.
- 03Exploratory Technology (10%)Investigate machine learning, digital twins, or advanced materials that shift the entire curve upward rather than just moving along it.
The Discipline to Stop
Stopping improvement work on a process that is already performing at an optimal level is a sign of engineering maturity. It is resource allocation. The best quality leaders maintain a clear hierarchy of pending work and have the discipline to say a process is good enough for now. This is not good enough forever, nor is it an excuse to never review it again. It is a temporary state that acknowledges the reality of finite resources.
Tomorrow, the customer's expectations might change. Regulatory environments under EASA or FDA guidelines might shift. The competitive landscape might demand higher capability. When that happens, you invest again, right there on the steep part of the curve where the returns are magnificent. You do not pre-emptively spend millions today to defend against a hypothetical requirement tomorrow.
The organizations that achieve the highest overall quality levels do not chase perfection everywhere equally. They invest aggressively where failure modes dictate, and they accept deliberate adequacy where it does not. The ultimate metric of quality excellence is not your sigma level, your Cpk, or your zero-defect count. It is the ratio of value created to resources consumed across the entire manufacturing enterprise.
The curve bends. It always bends. The winners are the ones who read it honestly, allocate their PPAP and APQP resources accordingly, and refuse to throw good money after diminishing returns. Mastering this economic discipline ensures your quality system remains a competitive advantage rather than a financial anchor.