I have walked into plants that employ more inspectors than operators. You can map the entire history of their quality anxiety in the layout of the floor. Incoming inspection sits here. In-process inspection sits there. Final inspection spans across the back. Then a second pass of final inspection because the first pass was not catching everything. Then statistical sampling on top of the inspections. Then an audit team to audit the inspection teams.
In one facility I consulted for, the cost of detecting a single defect had exceeded the cost of the product itself. The defect rate was 1.2 percent, down from 4.3 percent three years earlier. The journey from 4.3 percent to 2.1 percent had cost roughly €180,000 and taken eight months. The journey from 2.1 percent to 1.2 percent cost €1.4 million and took two years. The next reduction to 0.8 percent was projected to cost €3.2 million.
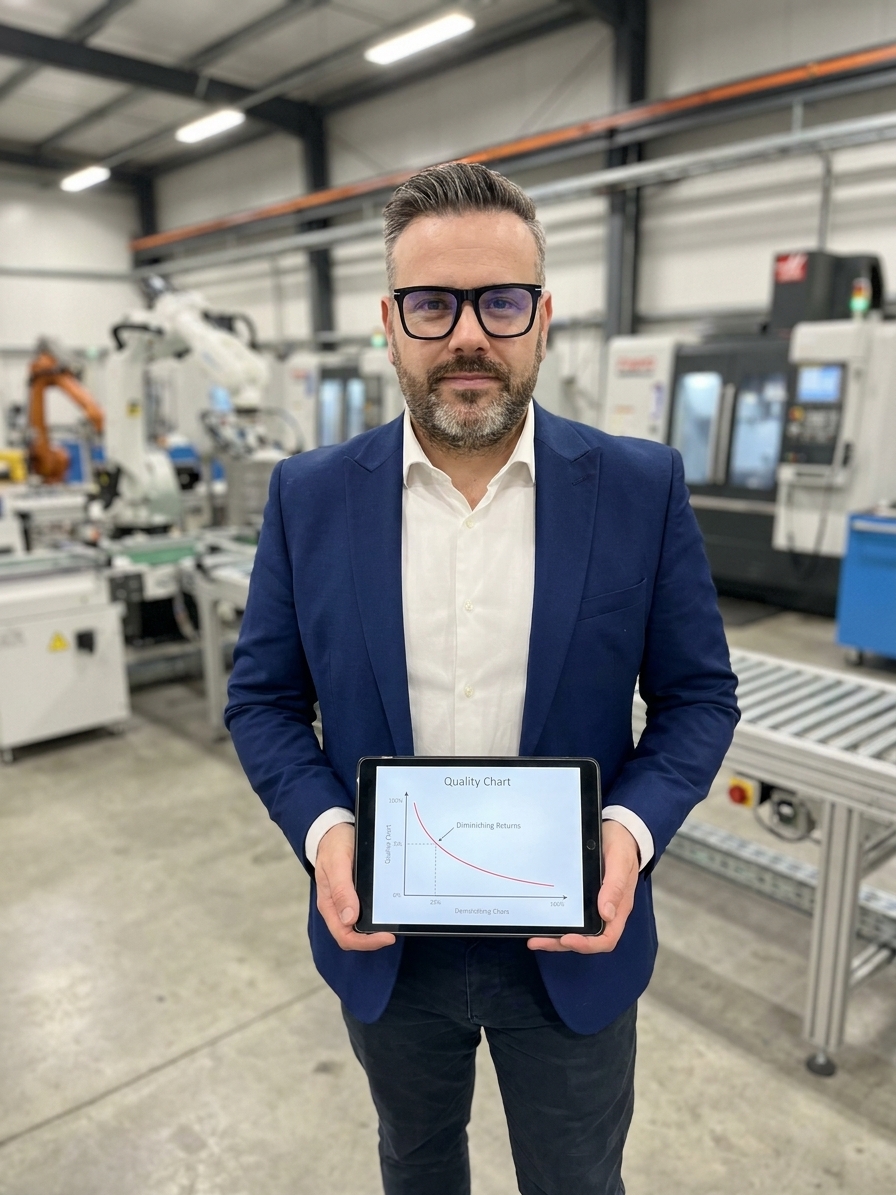
That is the law of diminishing returns in quality engineering. If you do not understand where your operation sits on that curve, your ISO 9001 system will consume the resources meant for innovation, delivery, and customer value.
The Mathematics of Inspection Decay
The law of diminishing returns states that as you increase investment in a single variable while holding others constant, the incremental gains from each additional unit of investment will eventually decrease. In quality, this manifests in ways that are both predictable and mathematically verifiable. We see it most clearly in the compounding inefficiency of linear inspection.
Your first inspection step will catch roughly 60 percent of defects. The second step catches 25 percent. The third catches 10 percent. The fourth catches 3 percent. By the time you add a fifth step, you are quintupling your inspection cost to capture a residual one percent of nonconforming product. This is not a process failure. It is the mathematical reality of sorting operations.
We see the exact same decay curve in preventive activities like PFMEA development. Your first drafting session identifies about 70 percent of critical risks. A second revision captures another 15 percent. The third adds 5 percent. After that, you are rearranging Risk Priority Numbers without changing the physical reality of the process. The exercise becomes documentation for its own sake, a trap disguised as diligence.
Mapping the Three Zones of Quality Investment
I map quality investments across organisations using three distinct zones. Understanding where your current budget lives determines whether your next euro buys real capability or just organisational noise.
The Quality Investment Maturity Curve
- Zone One: The HarvestHigh return, low effort. Implementing SPC on top defect categories and basic MSA. Expect 30-50% defect reduction rapidly.
- Zone Two: The GrindModerate return, significant effort. Tackling multi-factorial defects and supplier development. Each improvement costs 3-5x Zone One.
- Zone Three: The AbyssMinimal return, maximum effort. Cost of the next improvement exceeds the value it creates. Inspection is over-engineered.
Zone One is where most organisations start. Quick wins are readily available. Implementing basic statistical process control on your top three defect categories and writing standard work instructions for your five most variable stations will drop defect rates by 30 to 50 percent within months. The return on investment is extraordinary.
Zone Two is where real quality maturity begins. You have captured the easy wins, and now you are dealing with problems that do not yield to simple solutions. Process capability improvements demand equipment investment. Supplier quality issues require intensive development rather than passive incoming inspection. A Six Sigma DMAIC project might take four months and deliver solid savings, but the effort is substantial.
The Optimization Trap: Cost of Quality
Organisations get into trouble when they confuse optimisation with maximisation. Maximisation says you must reduce defects as close to zero as physically possible, regardless of cost. Optimisation says you must find the point where the total cost of quality, which includes prevention, appraisal, and failure costs, is at its absolute minimum.
The classic cost-of-quality model illustrates this mechanism. As you invest more in prevention and appraisal, your internal and external failure costs decrease. But at a specific intersection, the additional prevention and appraisal costs exceed the failure costs they prevent. That intersection is your optimal operating point.
Finding the Optimal Quality Operating Point
I worked with an automotive supplier that was spending €2.3 million annually on final inspection to prevent an estimated €400,000 in warranty claims. The plant manager defended the expense by citing recall risk. We calculated the recall risk based on their defect categories, traceability system, and historical data. The probability of a recall-causing defect escaping their existing systems was less than 0.01 percent per year. The expected annual cost of that risk was roughly €35,000.
They were spending €2.3 million to prevent a €435,000 problem. That is not quality engineering. That is anxiety with a budget.
Hidden Diminishing Returns in Compliance
Diminishing returns do not just apply to detection. They lurk in calibration, documentation, and training, often disguised as due diligence required by IATF 16949 or AS9100.
Risk-Based vs Calendar-Based Compliance
What teams do
- Calibrate every gauge monthly regardless of drift history.
- Generate 47-page work instructions that operators ignore.
- Force annual refresher training on experienced operators.
- Add inspection layers to handle every field return.
What works
- Calibrate high-criticality, high-drift instruments more frequently.
- Condense documentation to the critical parameters.
- Assess practical competence instead of tracking classroom hours.
- Implement error-proofing at the source rather than sorting.
I audited a manufacturer that calibrated every measuring instrument monthly, including stable warehouse temperature sensors that had not drifted in three years. The calibration technician spent 60 percent of his time on instruments that did not need attention while critical process instruments waited. We shifted to a risk-based calibration interval. High-criticality, high-drift instruments were calibrated monthly. Stable instruments were moved to semi-annually. We halved the cost while maintaining identical measurement confidence.
We see the same decay in training matrices. An experienced operator who has performed a task flawlessly for five years does not need the same refresher training as a new hire. Treating them identically creates training fatigue. Smart organisations assess competence through practical demonstration rather than tracking hours spent staring at a slide deck. They focus training on what changed in the process, not on what the operator already mastered.
Identifying Your Crossing Point
If your quality department grows faster than your production output, you have entered the abyss of negative returns.
To separate necessary quality investment from wasteful over-engineering, you must track your cost of quality religiously. If you are not measuring prevention costs, appraisal costs, internal failure costs, and external failure costs separately, you are operating blind. When your prevention and appraisal costs rise faster than your failure costs fall, you have crossed into negative returns.
Challenge every layer in your control plan. For every inspection point, ask what would happen if you removed it. If the answer is a defect will reach the customer, the control earns its place. If the answer is the next inspection step would catch it anyway, you have found accidental redundancy. Redundancy is acceptable only when justified by high-severity risk, not by institutional inertia.
Listen to your quality engineers. When they ask why a process needs another layer of control, they are identifying over-engineering. Create an environment where they can flag this without appearing to compromise standards. The goal of a quality system is to enable profitable delivery, not to generate paperwork for its own sake.
The Paradox of Continuous Improvement
The continuous improvement movement created a dangerous assumption: every process must be continuously improved. This is false. Some processes need to be continuously maintained. There is profound economic value in stability.
A process running at Cpk 1.67 that has not drifted in two years does not need a Six Sigma project. It needs a robust control plan, SPC monitoring, and the discipline to leave it alone. The impulse to improve everything everywhere all the time is not continuous improvement. It is continuous disruption. It generates change fatigue, destabilises capable processes, and erodes operator mastery.
The mature quality organisation knows which processes to improve, which to maintain, and which to leave alone. That judgment is worth more than any statistical tool. The European plant with 340 inspectors eventually faced board intervention because their cost of quality hit 23 percent of revenue. They reduced inspection to targeted stations, invested in prevention, and accepted a 0.5 percent target instead of chasing zero. Their cost of quality dropped to 7 percent, and profitability more than doubled.
Their customers never noticed the slight increase in defect rate. Diminishing returns is not a limitation. It is a compass. It tells you exactly where to stop digging and start building something else.