A production line runs at a stable 0.3% defect rate for three weeks. On Thursday, four defects appear in a single shift. Friday brings three more. The plant manager opens a corrective action and demands an explanation for the trend. A quality engineer spends the weekend investigating.
They find nothing. There is nothing to find because there is no trend. Seven consecutive defects clustered across two shifts is exactly what a stable process produces under normal probability. The cluster is inevitable, not exceptional.
I have audited plants where this scenario repeats weekly. An organisation that cannot distinguish between common cause variation and special cause signals will spend its quality budget chasing statistical ghosts. Worse, the adjustments made to 'fix' the phantom trend will introduce new variability into a process that was already capable.
The Mechanics of the Gambler's Fallacy
The Gambler's Fallacy is the cognitive error of believing that independent random events are influenced by past outcomes. If a coin lands heads five times consecutively, the human brain insists tails is 'due'. It is not. The coin has no memory. The sixth flip remains a 50/50 probability.
In a manufacturing context, this fallacy drives two destructive behaviours. First, the 'due for failure' variant: after a long run of good results, managers brace for disaster. They begin over-adjusting stable processes and second-guessing accurate measurements. They initiate improvements to processes that require no intervention.
Second, the 'due for improvement' variant: after a string of defective batches, teams assume the next run will self-correct. This creates dangerous complacency. If an actual assignable cause is driving the failures, waiting for statistical regression is professional negligence. Both errors stem from the same root: a fundamental misunderstanding of what randomness looks like in physical processes.
The Two Faces of Process Superstition
'Due for failure' (Overreacting)
- A long run of good results triggers preemptive anxiety.
- Teams tamper with stable parameters that are already optimised.
- Valid measurements are questioned and manually re-verified.
- Pre-emptive 'improvements' introduce entirely new variability.
'Due for improvement' (Underreacting)
- Consecutive defective batches are dismissed as statistical noise.
- Teams wait for the process to self-correct instead of acting.
- Actual assignable causes go unidentified and unaddressed.
- Special cause variation spreads, halting production entirely.
Why Randomness Clusters
Most people fundamentally misunderstand randomness. They assume a process averaging 2% defects should produce approximately 2% defects every single day. Any deviation from that daily average feels like a signal demanding explanation.

But random distributions do not behave uniformly. A stable 2% average process will naturally produce days with zero defects and days with 5% defects. Clusters of bad days will occur without any change to the inputs. This clustering is not a sign of failure; it is the mathematical signature of randomness.
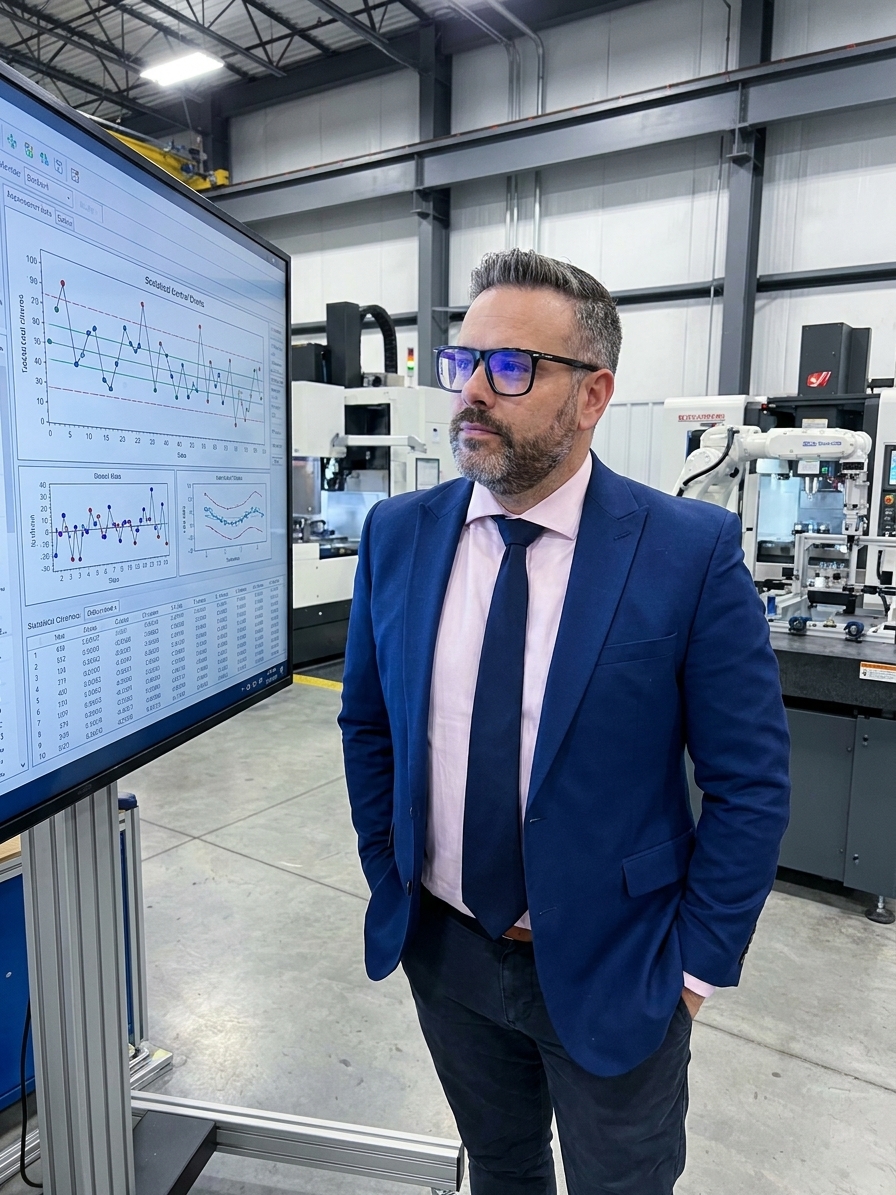
Walter Shewhart addressed this in 1924 with the invention of the control chart. His framework distinguishes between common cause variation, which is inherent to the process and not worth investigating individually, and special cause variation, which indicates something actually changed and demands immediate investigation.
Shewhart's rule is specific. If data points fall within upper and lower control limits and display no non-random patterns, leave the process alone. If a point falls outside those limits, or if a sustained run occurs on one side of the average, investigate. The Gambler's Fallacy causes organisations to violate both rules: they investigate points inside the limits while ignoring the systemic signals that actually matter.
The Mechanics of Process Tampering
W. Edwards Deming rigorously demonstrated the dangers of tampering through his famous funnel experiment. If you adjust a stable process every time it deviates from a target mean, you will increase variation rather than reduce it. Every manual adjustment introduces a new source of variability into the system.
Consider a CNC machining centre producing shafts with a target diameter of 50.000 mm and a tolerance of ±0.010 mm. The process is stable and capable, running with an established Cpk. On Monday, the first three parts measure 50.008, 50.009, and 50.008 mm.
The operator sees these measurements trending toward the upper limit and adjusts the machine down by 0.005 mm. The next parts measure 49.996, 49.994, and 49.993 mm. Now the process is drifting toward the lower limit, prompting another adjustment back up.
This oscillation, caused entirely by the operator chasing random noise, effectively doubles the variation in the process. Parts that would have naturally centred around 50.000 mm are now bouncing between the extremes. The operator, believing they are tightly controlling the process, has actively degraded its capability.
How Misinterpretation Destroys Capability
A pharmaceutical plant tracked sterility test failures and saw a jump from a 0.2% baseline to 0.6% for three consecutive months. The QA director launched a major investigation, intensifying environmental monitoring, retraining personnel, revising gowning procedures, and inspecting HVAC systems. The effort cost over €200,000.
No assignable cause was identified. The failure rate returned to 0.2% on its own, exactly as statistical theory dictates. The three-month cluster was a random fluctuation that looked significant to human eyes but failed a chi-square test for significance.
The damage compounded. The intensified monitoring detected trivial organisms that had always been present but previously went untracked. This triggered a cascade of deviations and CAPAs that consumed QA resources for nine months, draining capacity from actual improvement initiatives.
When you try to improve a process in response to common cause variation, you are no longer managing quality. You are tampering.
Conversely, an aerospace manufacturer experienced four consecutive batches of composite panels failing ultrasonic testing. Influenced by the 'due for improvement' fallacy, the quality team initially dismissed the failures as random noise, assuming the reliable process would self-correct.
Batches five, six, and seven also failed. By the time the team accepted that a real trend existed, they had lost three weeks of production and scrapped €1.2 million in material. The actual cause was a supplier quietly changing a resin formulation—a special cause easily detectable after the second failure.
Organisational Drivers of Statistical Waste
The Gambler's Fallacy thrives in specific organisational cultures. Dashboard culture is a primary accelerator. When every metric is displayed in real-time on a screen, every routine fluctuation becomes highly visible. Dashboards cannot distinguish between common cause and special cause variation; they simply display numbers moving up and down, inviting everyone to construct an explanation for the noise.
The weekly review cycle compounds the problem. When quality managers must explain every deviation in a periodic review, they will fabricate narratives to explain random variation. 'It's statistical noise' is rarely accepted as an answer, so intelligent people invent plausible but entirely fictional root causes to satisfy leadership demands.
Incentive structures tied to monthly defect rates further distort behaviour. Managers treat every monthly fluctuation as a direct reflection of their personal competence. This drives action bias—the organisational reflex that rewards visible intervention over disciplined observation, even when intervention actively degrades the process.
Drivers of Statistical Waste in Quality Management
- Action BiasLeadership demands visible intervention; disciplined observation is rarely rewarded as leadership.
- Incentive StructuresMonthly defect metrics tied to personal performance drive overreaction to routine shifts.
- Weekly Review CyclesForces engineers to invent root causes for random variation when 'statistical noise' is unacceptable.
- Dashboard CultureReal-time displays amplify visibility of routine fluctuations without statistical context.
Implementing Statistical Discipline
Breaking free from the Gambler's Fallacy requires strict statistical discipline. Control charts must function as primary decision-making tools, not wall decorations or formalities. If a data point falls inside control limits and shows no non-random patterns, the correct action is no action. This discipline feels counterintuitive. Enforce it anyway.
Establish investigation triggers before events occur. Do not decide retrospectively whether a defect cluster warrants an 8D. Define the rules in advance: a specific number of points outside defined sigma limits triggers an investigation. A sustained run of points on one side of the mean triggers an investigation. Document everything else, but do not investigate individually.
Separate process monitoring from process improvement. Monitoring detects special causes. Improvement reduces common causes. These are fundamentally different activities requiring different resources. When teams attempt to improve a process in response to common cause variation, they tamper. Assign separate mindsets and separate meetings to these distinct functions.
Audit your CAPA system for Gambler's Fallacy waste. Review the last fifty corrective actions. Determine how many were opened in response to events that were within normal process variation. Identify how many concluded with 'no assignable cause identified' or 'operator retrained'. Every CAPA that investigates noise consumes resources from genuine signals.