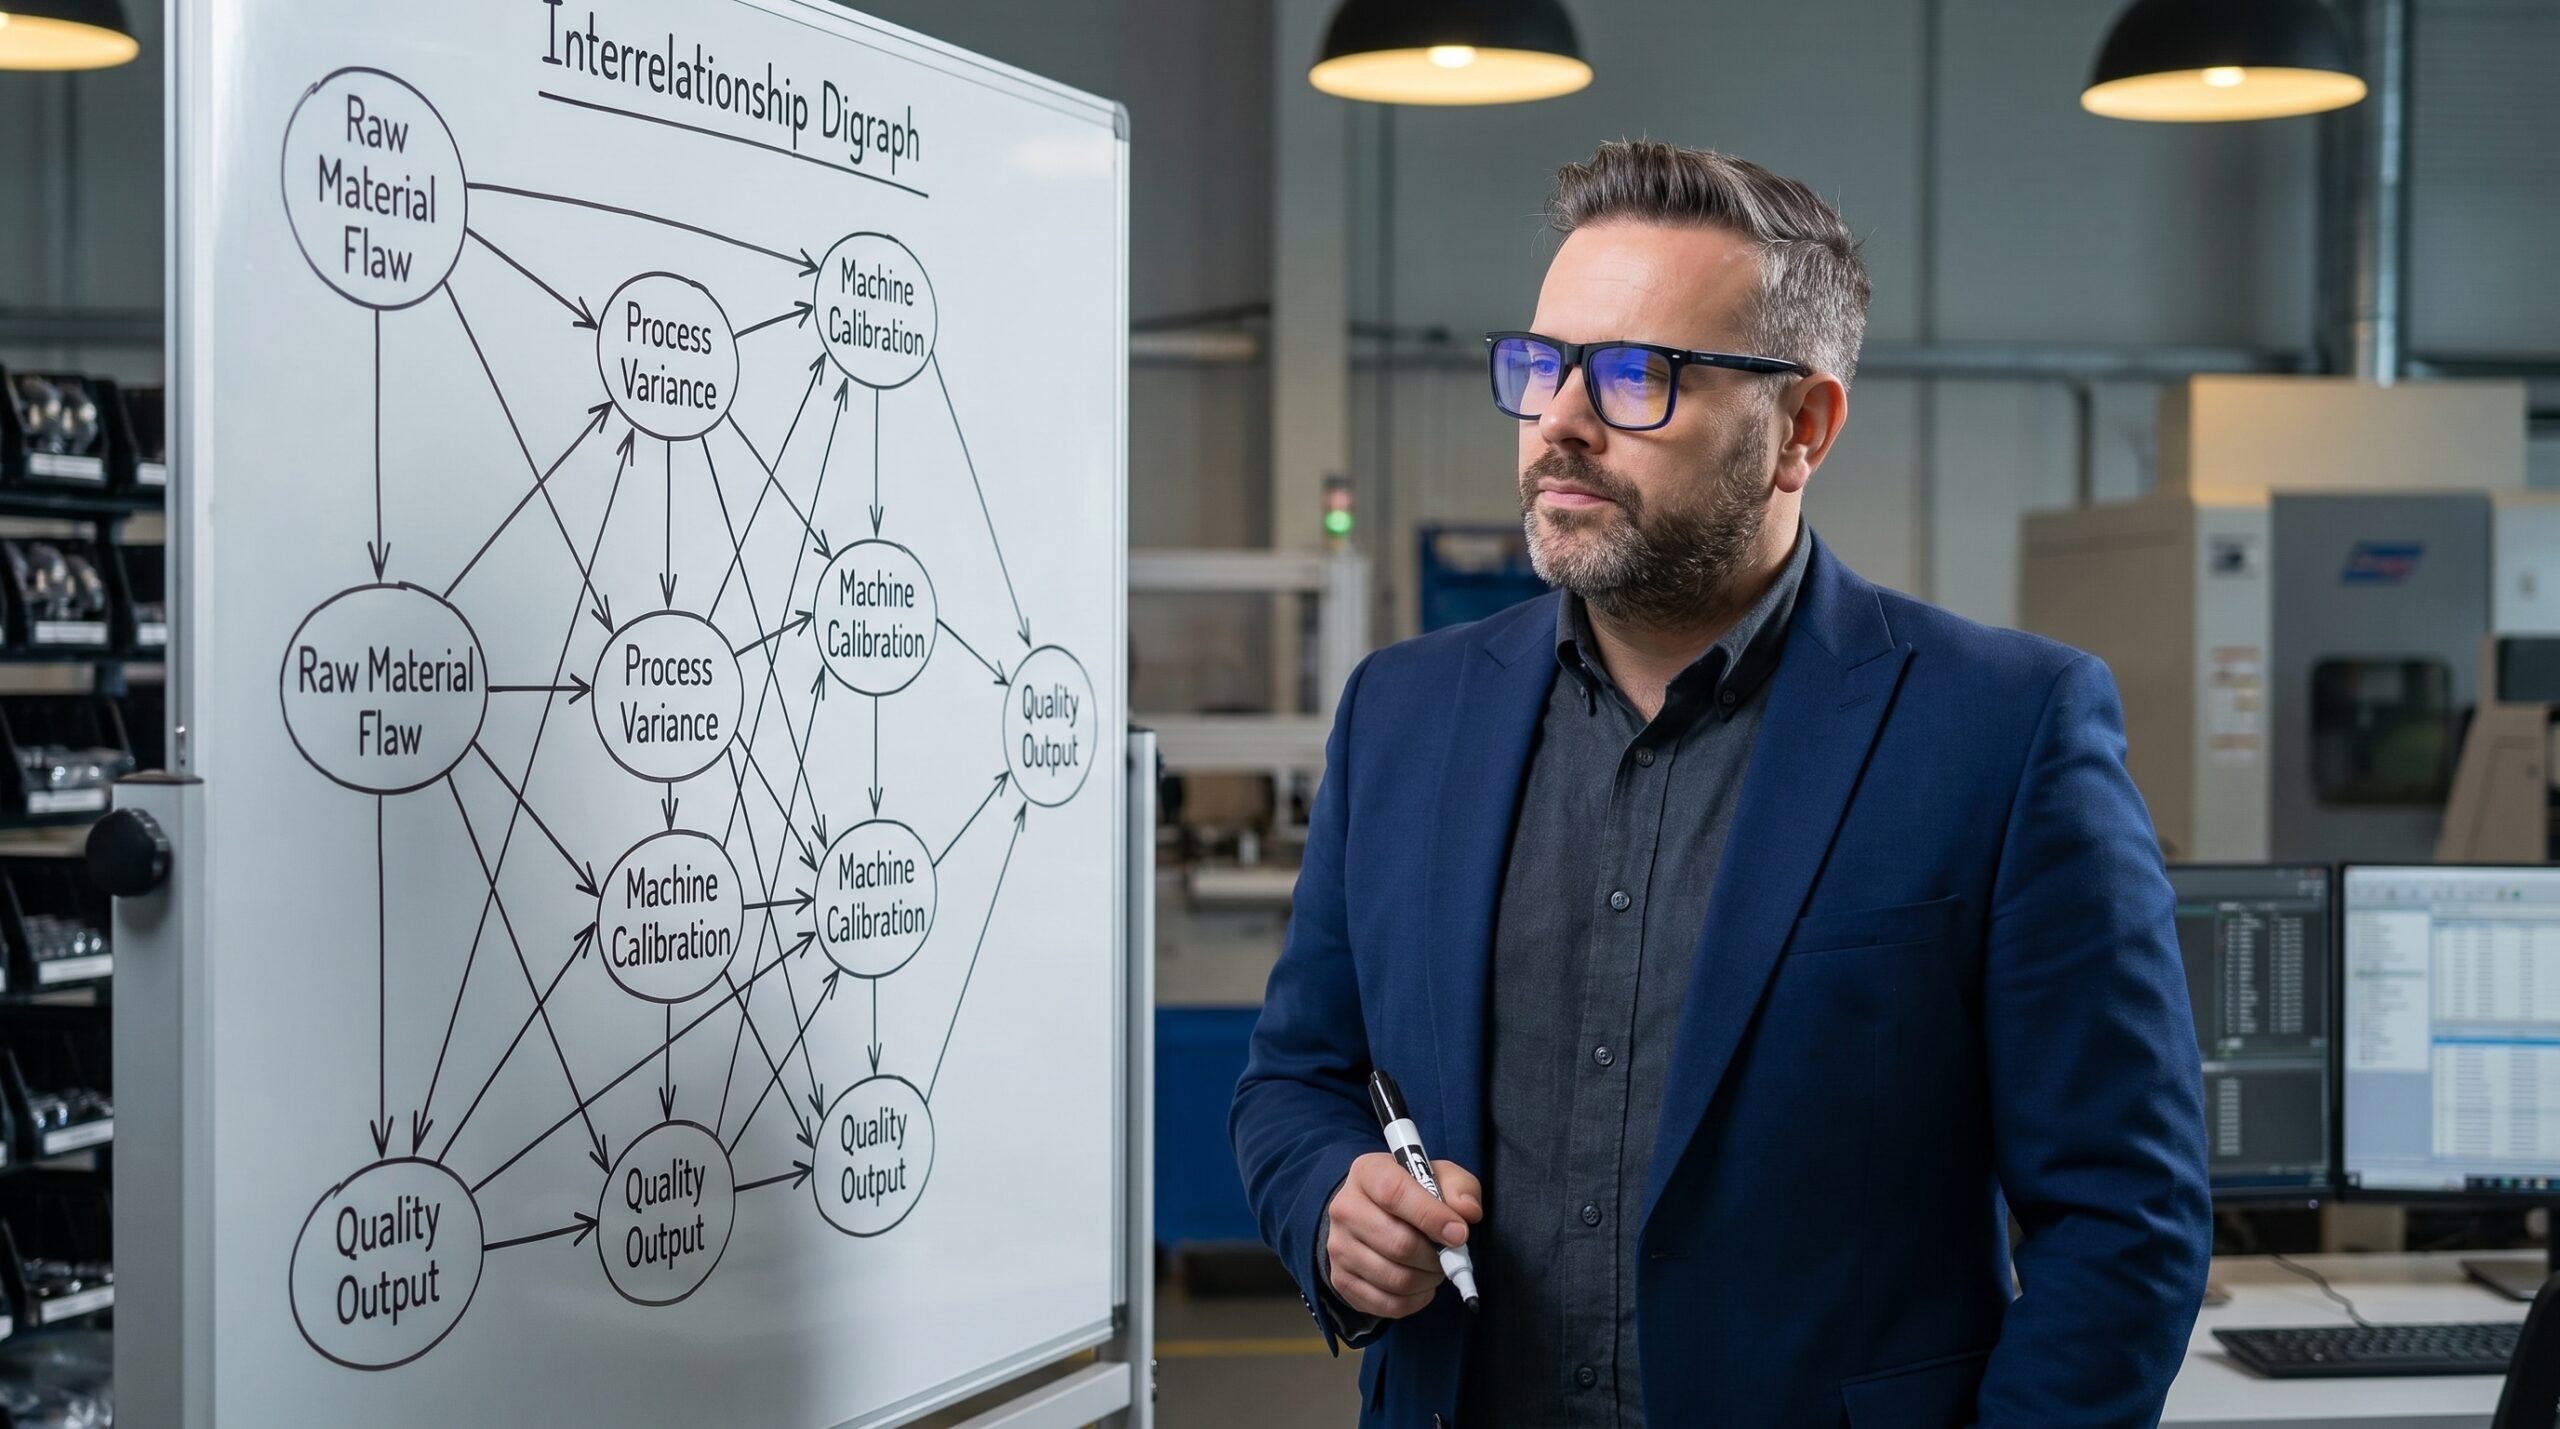
Three customer complaints in a single month. Three 8D teams formed. Three different root causes identified through 5-Why and Ishikawa analysis, and three corrective actions implemented. The dimensional failure on the gearbox cover persisted across all of them.
I have audited plants where this exact scenario plays out repeatedly. In complex manufacturing systems, causes and effects rarely arrange themselves in neat linear chains. They overlap, feed back on each other, and create tangled paths that standard root-cause tools cannot trace. When three competent teams look at the same defect and find three different causes, the tool is failing the team.
The Interrelationship Digraph (ID) exists for exactly this failure mode. It maps the logical relationships between factors, exposes where feedback loops hide, and identifies the single factor driving the majority of the system's behaviour. It does not replace 5-Why or Ishikawa — it sits between them, turning a static list of suspected causes into a functional model of how the process actually behaves.
Why Linear Tools Hit a Wall
5-Why traces a single chain of causality. It assumes that asking 'why' sequentially will drill down to a root cause. In mechanically simple processes — a broken sensor, a missed step — this works. In injection moulding, machining, or any process with interacting variables, the single-chain assumption collapses.
Ishikawa generates a structured list. It organises causes into categories — Man, Machine, Method, Material, Measurement, Environment — but it makes no claim about which cause matters most. A team can brainstorm forty factors, put them on a fishbone diagram, and leave the room with no clearer understanding of where to intervene than when they entered.
The ID forces a different question. Instead of asking 'what causes the defect,' it asks 'how do these factors influence each other.' That shift exposes the difference between a symptom that looks like a cause and the systemic driver that actually sustains the failure.
In the gearbox cover case, the three teams had identified mould temperature, injection pressure, and material batch as their respective root causes. All three were real factors. None of them was the driver. They were downstream effects of something the teams had not considered, because Ishikawa and 5-Why provided no mechanism to see the upstream connections.
Building the Digraph: A Structured Method
We convened a cross-functional team — process engineer, operator, maintenance technician, quality inspector, tooling designer — and collected every factor with a plausible link to the dimensional deviation. We did not filter for root causes at this stage. We collected factors. Within an hour, we had fourteen, ranging from mould temperature and cooling rate to ambient humidity and shift-to-shift communication.
Each factor went onto a separate card. Then the systematic work began. We took each factor and compared it against every other factor, asking one question: does factor A influence factor B? If yes, we drew an arrow from A to B and assigned a weight — 1 for weak, 3 for moderate, 9 for strong. No bidirectional arrows were allowed. If the team believed the influence ran both ways, they had to decide which direction was dominant and draw a single arrow.
The Interrelationship Digraph Method
- 01Collect factorsGather all plausible factors from a cross-functional team. Do not filter for causes at this stage.
- 02Pair and weightCompare every factor against every other. Assign direction and strength of influence (1, 3, 9).
- 03Count arrowsFor each factor, count outgoing arrows (Out) and incoming arrows (In).
- 04Calculate net influenceSubtract In from Out. High positive scores indicate drivers; high negative scores indicate symptoms.
- 05Verify with dataTake the top-scoring drivers and confirm the relationship against process records.
The discussion during pairing is where the method earns its keep. When the process engineer stated that mould temperature had no influence on mould cleanliness, the maintenance technician pushed back: residue accumulation accelerates at higher temperatures. That exchange — technical assumption meeting floor reality — is the core value of the ID. The diagram is a byproduct. The structured argument is the output.

Reading the Map: Drivers vs Symptoms
With all relationships mapped, each factor receives two scores. Outgoing arrows (Out) represent how many other factors this one influences. Incoming arrows (In) represent how many factors influence it. The arithmetic is simple: subtract In from Out. Factors with the highest positive difference are the system's driving forces. Factors with the highest negative difference are the system's key indicators — the symptoms that tell you the system is unhealthy.
The gearbox cover digraph produced a result the team did not expect. The factor with the highest Out score — the strongest driving force — was mould maintenance frequency. Not mould temperature. Not injection pressure. Not material batch. Mould maintenance frequency.
The logic, once visible on the map, was irrefutable. Worn valves alter heat distribution, which changes mould temperature. Debris accumulating in corners affects mould cleanliness, which distorts dimensional accuracy. Worn guide pins allow shift, which the operator compensates for by extending hold time, which alters cycle time. Mould maintenance frequency was driving five downstream factors. The three teams had been chasing symptoms — temperature, pressure, material — while the degradation of the tool itself went unaddressed.
The problem rarely lies where you are looking for it. It lies at the intersection of factors no single discipline owns.
Acting on the Finding
Armed with the digraph, we designed two targeted interventions. We did not touch mould temperature, injection pressure, or material specification — the factors the three original teams had pursued. We addressed the two highest-scoring drivers on the map.
The first was a preventive mould maintenance plan: systematic inspection and replacement of critical components — valves, guide pins, cooling channels — every 5,000 cycles, replacing the reactive 'fix it when it breaks' approach. The second was a standardised setup protocol: a unified parameter record handed over between shifts, with no operator permitted to change settings without process engineering approval.
Dimensional deviation dropped by 70% within six weeks. Customer complaints on the parameter fell to zero within three months. The team had spent weeks adjusting process parameters that were themselves being driven by an unrecognised upstream cause. Once the driver was controlled, the downstream variables stabilised on their own.
Impact of Targeting the True Driver
Selecting the Right Tool for the Problem
The ID is not an everyday tool. It consumes time — a proper session with 10 to 14 factors takes a full day with a committed cross-functional team. Applying it to a problem that 5-Why can solve in twenty minutes is waste. Applying 5-Why to a problem that needs an ID is how plants end up with three teams finding three different causes and solving none of them.
The decision rule is straightforward. Use 5-Why when the problem has a single, traceable linear chain — a sensor failure, a procedural deviation, a clear equipment malfunction. Use Ishikawa when the team needs to brainstorm and categorise possible causes in a structured way. Use the ID when the team already has a list of factors and cannot agree on which one matters, or when implemented solutions are not working because they target symptoms rather than the systemic driver.
The most effective sequence I have used combines all three. Ishikawa to generate the full set of candidate factors. ID to map their interactions and rank them by net influence. Then 5-Why drilled into the top-scoring driver — the factor with the highest Out-minus-In score — to verify the causal chain before committing resources to a corrective action.
| Tool | Best Applied When | Limitation |
|---|---|---|
| 5-Why | Single linear causal chain is expected | Cannot trace interacting or feedback-driven variables |
| Ishikawa | Team needs to brainstorm causes across categories | Generates a list but does not rank relative influence |
| Interrelationship Digraph | Factors interact and the root cause is disputed | Requires significant team time and disciplined facilitation |
| ID plus 5-Why combined | Complex system with a confirmed top driver | Demands cross-functional availability and data to verify |
Field Rules for a Productive Session
Limit the factor count to between 7 and 15. Below 7, a structured discussion is sufficient — the diagram adds no value. Above 15, the map becomes unreadable and the pairing exercise consumes more time than the insight justifies. If Ishikawa produces more than 15 candidate factors, cluster them first using an Affinity Diagram, then carry the consolidated headers into the ID.
Ban bidirectional arrows. If the team believes A drives B and B drives A, force a decision: which influence is stronger? Draw one arrow in that direction. Bidirectional arrows create visual noise and undermine the entire purpose of the tool, which is to establish directional causality. Similarly, watch for the 'everything influences everything' pattern. If every factor connects to every other factor with strong arrows, the factors are too abstract. Break them into specific, measurable elements — replace 'human factor' with 'operator training on mould temperature setup.'
The 80/20 rule applies. Of ten factors on a well-constructed digraph, two or three will emerge as primary drivers. The rest are symptoms, secondary effects, or noise. Concentrate your corrective actions on the factors with the highest positive Out-minus-In scores, and resist the urge to address everything the team identified.
Most critically, verify the digraph's output with hard data. The ID is a qualitative tool — it maps the team's understanding of the system. If the digraph identifies mould maintenance frequency as the primary driver, pull the maintenance logs. Cross-reference maintenance intervals against dimensional deviation data in the quality records. If the correlation does not hold, the team's mental model of the process is wrong, and the digraph needs revision before you commit to corrective actions.
Software can automate the scoring and visualisation. Excel templates and dedicated quality management applications handle the matrix-to-diagram conversion instantly. But the discussion the diagram provokes — the engineer defending an assumption, the operator contradicting it with evidence from the floor — cannot be automated. The diagram is the tool. The structured argument is the method.