
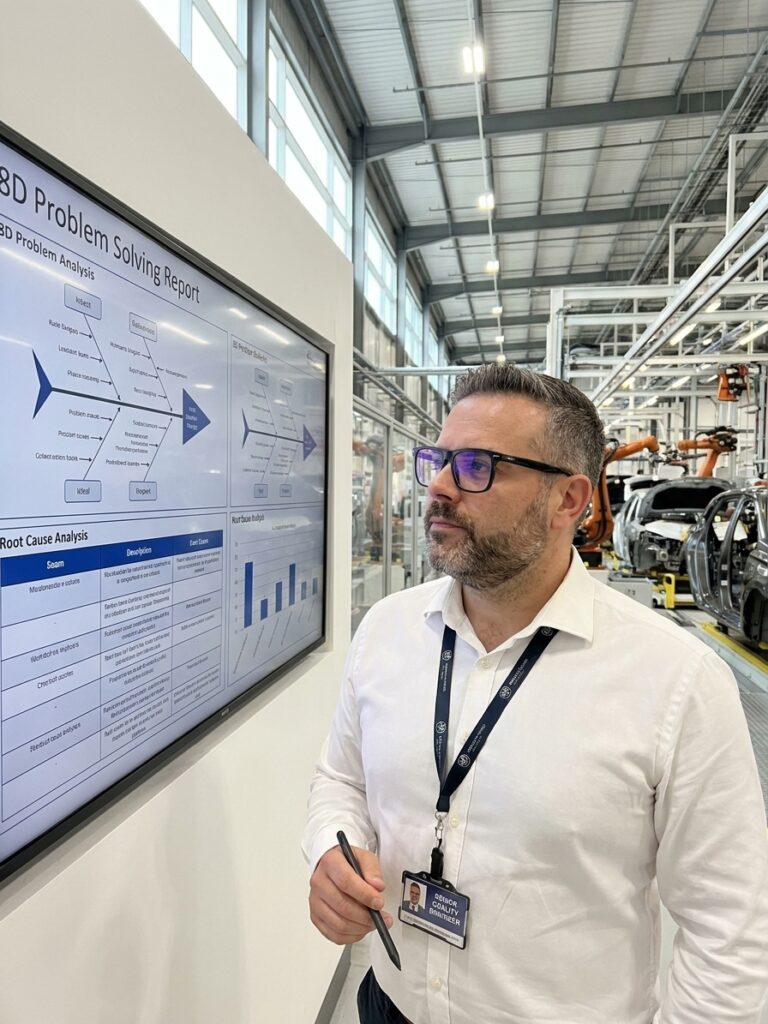
You know the shape. A horizontal arrow points to a boxed problem statement on the right. Diagonal bones branch off the spine, labelled with classic categories: Man, Machine, Method, Material, Measurement, Environment. Sub-bones sprout from each diagonal, capturing potential causes brainstormed by a team in a room that smells like dry-erase markers and stale coffee. The diagram gets drawn, the bones get filled, and the flipchart gets photographed.
Then the team disperses, the problem persists, and six months later someone draws another fishbone for the same issue because the first one is buried in a shared drive folder nobody can find. The Ishikawa Diagram, invented by Kaoru Ishikawa in the 1960s, was built to structure the investigation of quality problems. Today, it has devolved into one of the most heavily misused instruments in the quality profession. It satisfies a documentation requirement but rarely solves the problem.
The failure is not in the tool's design. The failure is in skipping the convergence and validation phases that Ishikawa's methodology demands. Teams treat the diagram as a brainstorming endpoint rather than the structured front end of a rigorous, data-driven investigation. Changing this requires dismantling the bad habits that have infected corrective action workflows across IATF 16949 and AS9100 environments.
The mechanics of structured cause generation
Kaoru Ishikawa formalised this diagram to solve a specific behavioural problem during defect investigations. When teams investigate failures, they fixate on the first plausible explanation that surfaces. Someone blames the operator and the conversation ends. Someone blames the material supplier and the room agrees. The diagram forces the team to systematically consider multiple categories before converging on a root cause.
The standard categories, often remembered as the 6 Ms, are Man, Machine, Method, Material, Measurement, and Environment. Some practitioners add Management as a seventh category, covering policy decisions, resource allocation, and organisational structure. Others tailor categories to the specific problem, using Software, Suppliers, or System when the standard six do not fit. The power of the tool lies entirely in this structured prompts system.
Each bone is a prompt, not a conclusion. It is an invitation to ask what within this category could contribute to the problem. The team brainstorms, groups, and prioritises. Then, they must validate each potential cause with data. Ishikawa intended the diagram to drive systematic investigation, not to serve as a taxonomy for filing away untested opinions. When the categories become more important than the causes, the tool becomes a ritual.
Identifying the standard failure modes
I have audited plants and facilitated hundreds of fishbone sessions over twenty years. The failure modes are remarkably consistent. The most common is the brainstorm dump. A facilitator points at a blank flipchart and asks for causes. For forty-five minutes, the team calls out possibilities. Every suggestion gets written down. The diagram fills up. People feel productive, but nobody filters the output.
Nobody challenges the suggestions or asks if there is evidence that this actually contributes. The diagram becomes a laundry list of suspicions, not an analysis. When the session ends, the team has thirty-seven potential causes and no idea which one matters. The root problem is conflating generation with analysis. Brainstorming is a divergent activity, but the Ishikawa Diagram was designed to converge and narrow.
Another major failure mode is the drive-by diagram, prevalent in high-volume automotive manufacturing. A problem occurs, and the team draws a fishbone in thirty minutes during a status meeting. They circle three causes, assign actions, and close the meeting to satisfy an 8D deadline. Two weeks later, the problem recurs because none of the circled causes were actually validated. This creates the dangerous illusion that root cause analysis happened.
| Category | Standard Focus | Tailored Addition |
|---|---|---|
| Man (People) | Skills, fatigue, training | Staffing levels across shifts |
| Machine | Calibration, tooling wear | Software version control |
| Method | Procedures, sequencing | Changeover protocols |
| Material | Supplier variation, specs | Incoming logistics delays |
| Measurement | Gauge R&R, sampling plan | Fixture locators wear |
The critical gap: Hypotheses without data
The Ishikawa Diagram produces hypotheses, not conclusions. Each bone branch is a statement that says this factor might contribute to the defect. The word might is doing heavy lifting. Every credible quality framework, from ISO 9001 to VDA 6.3, requires that potential causes be verified before corrective actions are permanently implemented. Verification means data. It means going to the gemba and measuring the factor.
In practice, teams pick the cause that feels most plausible, assign a corrective action, and move on. No data, no verification, just consensus around a flipchart. I once worked with a Tier 1 automotive supplier that had a recurring dimensional defect on a critical machined surface. The fishbone session produced fourteen potential causes across all six categories. The team circled tool wear and coolant concentration, then launched actions.
Three months later, the defect was still present on the line. When we finally ran a multi-vari study, collecting data across shifts, machines, material lots, and operators, the actual driver was a temperature differential in the machine tool's hydraulic system. It varied directly with ambient shop temperature. This root cause had been listed on the Environment bone from day one, but nobody had validated it because they were too busy implementing unverified fixes.
Skipping data validation turns a precision diagnostic instrument into a theatrical compliance exercise.
Defining the problem with surgical precision
Before drawing a single bone, write the problem statement in specific, measurable terms. A vague statement like parts are failing inspection guarantees a scattered, useless diagram. A precise statement narrows the analysis. It tells the team exactly which process, which station, which timeframe, and which symptom to target. This single discipline immediately focuses the investigation and filters out irrelevant noise.
Consider the difference in approach. If the problem statement lacks parameters, the fishbone becomes a general discussion about everything that could possibly go wrong everywhere, which helps absolutely no one. A targeted statement like the one detailed below forces the team to look at localised process parameters. It anchors the subsequent brainstorming session in the reality of the manufacturing floor rather than abstract theories.
This precise definition is essential before any facilitator un-caps a marker. Without an anchor, you will spend twenty minutes watching engineers argue over whether a cause belongs under Method or Material while the actual defect continues rolling off the production line. Insisting on this level of detail is the facilitator's primary job. If the team cannot define the defect precisely, they are not ready to diagnose it.
Anatomy of a precise problem statement
Prioritising causes and executing validation
After precisely defining the problem, use round-robin brainstorming rather than open discussion. Open discussion favours the loudest voices in the room, typically the process engineer who already has a theory and the operator who wants to blame maintenance. Round-robin forces every participant to contribute causes across every category, surfacing critical perspectives that would otherwise stay completely silent. Set a strict limit of fifteen minutes for generation.
Spend the next forty-five minutes on what matters: evaluation. Have the team rate each potential cause on two dimensions: likelihood and confidence. A simple one-to-three scale works efficiently. Causes that score high on both go to the top of the validation list. Causes that score high on likelihood but low on confidence are the highest priority for immediate data collection. These are the variables the team believes in but has not verified.
For each high-priority cause, define a specific validation method. Use historical data analysis to pull production records and inspection data, checking if the defect correlates with the suspected factor. Go to the process for direct measurement, logging temperature or gauging tool wear directly. Run a small designed experiment, varying the controllable factor and observing the response. Run an elimination test by changing material lots or operators.
The validation-driven fishbone process
- 01Define the problemIsolate the defect by part, station, and metric.
- 02Structured brainstormingRound-robin generation across the 6 Ms.
- 03Prioritise variablesScore every cause on likelihood and evidence.
- 04Data collectionRun multi-vari studies, DOEs, or elimination tests.
- 05Verify root causeConfirm the statistical link before assigning 8D actions.
Integrating Ishikawa with the problem-solving toolkit
The Ishikawa Diagram does not exist in a vacuum. It feeds directly into the next step of the structured problem-solving process. Validated causes must flow into a 5 Whys analysis to find the underlying systemic mechanism. Corrective actions must be tracked rigorously in an 8D or A3 format to ensure permanent implementation. Effectiveness checks must be verified using statistical process control or before-and-after capability studies.
When the fishbone is disconnected from the rest of the quality toolkit, it becomes a dead artifact. It becomes something the team produced simply because the corrective action procedure required it for compliance. Connected properly to validation, 5 Whys, and action tracking, it becomes exactly what Kaoru Ishikawa intended: the structured front end of a rigorous, evidence-based investigation that permanently eliminates process variation.
The gap between drawing a fishbone and finding a root cause is where the real engineering work lives. That gap is filled with data, discipline, and follow-through. In organisations where problem-solving is valued over fast closure, the fishbone works exactly as designed. It channels diverse perspectives toward evidence. Close that gap, and the tool delivers on its promise. Leave it open, and you are just wasting marker ink.