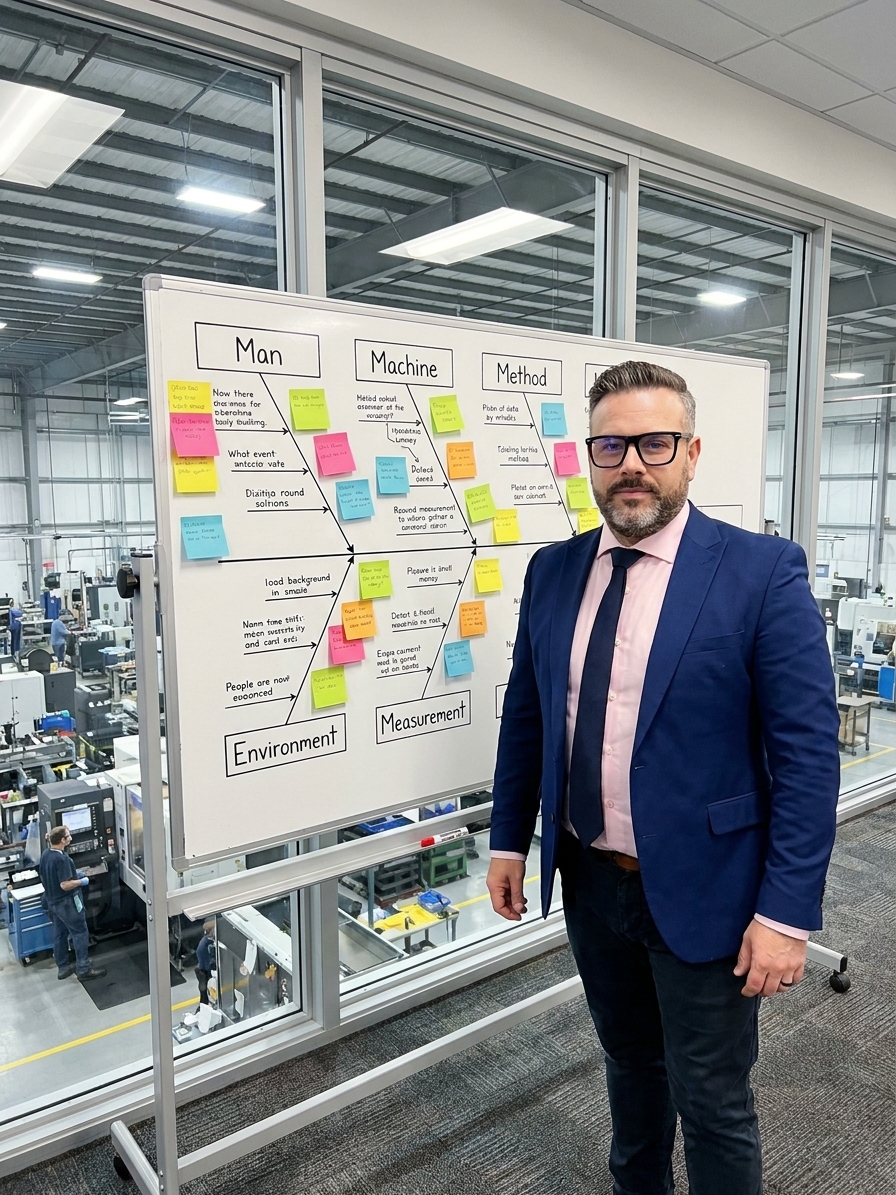
A defect rate spikes, a customer escalates a complaint, or a critical dimension drifts out of specification. Someone says, 'Let's do a fishbone.' The room gathers, a whiteboard gets claimed, and someone draws a long horizontal arrow pointing to a box that says 'Defect Rate.' Six branches extend from the spine: Man, Machine, Method, Material, Measurement, Environment.
People call out ideas, sticky notes go up, and the diagram fills. Everyone nods, takes a photo with their phone, and walks away feeling productive. Then nothing happens. The fishbone sits on the whiteboard until someone erases it for the next meeting. The problem persists, the fishbone gets blamed for being 'just theory,' and no corrective action is implemented.
The Ishikawa diagram is one of the most powerful structured thinking tools in quality management. But when organisations treat it as an endpoint rather than a starting point, it becomes a ritual. I have audited plants where the 8D report contains a pristine photograph of a fishbone diagram, yet the defect rate remains unchanged. The diagram exists as a compliance artifact, not an investigation.
The tool was built for thinking, not drawing
Kaoru Ishikawa built the diagram to solve a specific problem: human beings are poor at structured causal reasoning. When faced with a complex failure, our brains jump to the first plausible explanation and stop. We see a scratch on a part and blame the operator. We see a dimension out of tolerance and blame the machine. The fishbone forces us past that initial jump.
The 6Ms represent the six fundamental dimensions of variation in any manufacturing process. Every defect has causal roots in at least one of these categories. The framework gives teams a shared structure for investigation, preventing the common failure mode where the loudest voice in the room determines which causal path gets explored while all others are ignored.
But here is the critical point most practitioners miss: the fishbone diagram is not a root cause analysis tool. It is a cause enumeration and categorisation tool. It maps the territory of possible causes. It does not identify which cause is the actual cause. That distinction between mapping possibilities and confirming the real root cause is where nearly every fishbone exercise goes wrong.
How the fishbone dies: four phases of failure
The typical lifecycle of an Ishikawa diagram in a manufacturing environment follows a predictable decay. It begins with genuine enthusiasm. The problem is fresh, the team is motivated, and the structured categories prevent the discussion from devolving into random brainstorming. For about thirty minutes, it feels like real problem-solving is happening.

Then inflation sets in. The goal stops being 'find the root cause' and starts being 'fill in all six branches with at least four items each.' Teams pad the diagram with causes they know are irrelevant. 'Operator fatigue' goes under Man because every fishbone needs something there. 'Temperature variation' goes under Environment because the branch should not be empty. The diagram becomes a creativity exercise.
Paralysis follows. The team is staring at fifty potential causes with no methodology for narrowing them down. Someone suggests prioritising, and another meeting gets scheduled. That meeting either does not happen, or it becomes a voting exercise where people rank causes by gut feel rather than by data. The fishbone gets filed in the corrective action report as evidence that root cause analysis was performed. The problem continues.
The six failure modes in practice
Across automotive and aerospace plants, the failure patterns cluster into recognisable modes. Decoration mode is the most common: the fishbone is drawn to satisfy a corrective action requirement. A customer demands an 8D report, Step 3 needs content, and the team pastes a photo of the fishbone into the report. No causes were investigated, no experiments were run, and the customer accepts it because their own quality team does the same thing.
Blame mode is culturally driven. The Man branch fills up with 'lack of training' and 'failure to follow procedure.' The structural causes hiding in Machine, Method, and Material are never investigated because that would mean admitting the system is broken. The diagram looks thorough, but its conclusions were predetermined by the culture.
One-and-done mode is the most dangerous misuse. The team picks the 'most likely' cause from the fishbone without verification. No data is collected, no hypotheses are tested, and no 5 Whys are conducted. A list of unverified possibilities is not an analysis. It is a guess with visual aids, and the team genuinely believes they performed rigorous work because they have a diagram to prove it.
What a real investigation looks like
When the fishbone is used as designed, as the starting point of a structured investigation, the process looks fundamentally different. It begins with a precise problem statement. Not 'quality is bad,' but a specific, measurable definition: part number, operation, dimension, tolerance, measured value, percentage affected, date range, and unit count. The fishbone arrow points to a real problem.
Each cause written on the fishbone comes with a question: what data do we have that suggests this is contributing? If the answer is none, the cause goes on the diagram with a question mark. It is a hypothesis, not a finding. This prevents inflation and keeps the team honest about what they know versus what they are guessing.
The fishbone gives you the menu of suspects; interrogation happens afterwards.
For each candidate cause, the team defines what evidence would confirm or eliminate it. If operator fatigue is suspected, check whether defects increase in the last two hours of the shift. If tool wear is suspected, pull the tooling logs and correlate tool age with defect rate. This is where most teams stop, but this is where the actual analysis begins.
Connecting the fishbone to the quality toolkit
The Ishikawa diagram does not exist in isolation. It feeds naturally into 5 Whys analysis. Each terminal branch is a candidate for a drill-down. 'Tool wear' on the Machine branch becomes: why is the tool wearing prematurely? Because the cutting speed was increased. Why? Because the cycle time was too slow to meet demand. The chain continues until it reaches a procurement decision made eighteen months ago, the actual root cause of the defect.
The fishbone also connects directly to PFMEA. Each potential cause should be cross-referenced with the process FMEA. If the cause appears with a high RPN, it was a known risk that was not adequately mitigated. If it does not appear at all, the FMEA has a gap. This cross-reference strengthens both documents and feeds lessons back into preventive analysis for future processes.
Pareto analysis sits upstream of the fishbone. Before drawing the diagram, a Pareto chart of defect types tells you which problem deserves a fishbone. The fishbone tells you which causes deserve deeper investigation. The deeper tools tell you which cause is real. Using any single tool for the entire job is like trying to build a house with only a hammer.
The quality investigation pipeline
- 01Pareto analysisIdentifies which defect type or problem deserves a full investigation based on frequency and impact.
- 02Ishikawa diagramEnumerates and categorises potential causes across the 6Ms. Maps possibilities, confirms nothing.
- 03Data interrogationFor each candidate cause, define what evidence would confirm or eliminate it. Pull logs, check shift data.
- 045 Whys and DOEDrill into surviving candidates. Designed experiments and capability studies confirm the dominant source of variation.
- 05Corrective actionImplement a fix that maps to the confirmed root cause, not the branch that was easiest to address.
When not to use a fishbone
Not every problem needs an Ishikawa diagram. If the root cause is already known or strongly suspected, go directly to verification. If the problem is simple and has an obvious single cause, a 5 Whys is faster and sufficient. If the team lacks the time, data, or authority to investigate candidate causes, drawing the fishbone will only create frustration.
The fishbone is valuable when the problem has multiple potential causal categories and the team needs structure to explore them systematically. It works when the team is cross-functional and needs a shared framework to contribute knowledge from different domains. It is essential when the problem is chronic and recurring, suggesting that previous single-cause analyses missed something structural.
Ritual versus investigation
Fishbone as ritual
- Goal is a completed diagram for the 8D report
- Causes added by brainstorming and group consensus
- Prioritisation by voting or gut feel
- Ends when the whiteboard is full
Fishbone as investigation
- Goal is a confirmed root cause with data
- Causes treated as hypotheses requiring evidence
- Prioritisation by checking process logs and defect data
- Ends when a corrective action is verified
The cultural dimension
The failure of the Ishikawa diagram in most organisations is not a tool failure. It is a cultural failure. The diagram fails because the organisation values closure over investigation. The customer wants the 8D report by Friday. The plant manager wants the defect rate down by Monday. The quality engineer wants to close the corrective action before the audit. Nobody has the patience for a structured investigation that might take three weeks.
Kaoru Ishikawa did not just invent a diagram. He advocated for quality circles, frontline worker empowerment, and organisations that gave their people the time and authority to investigate problems rather than document them. The fishbone was designed for a culture that believed in finding root causes. In a culture that believes in closing tickets, no diagram will help.
The organisations that get value from Ishikawa diagrams treat them as the beginning of an investigation. They assign owners to each candidate cause, collect data before drawing conclusions, and follow the evidence even when it leads somewhere uncomfortable. A fishbone with sixty causes and zero confirmed root causes is a failure. If your fishbone exercises consistently produce diagrams but not corrective actions, the problem is not the diagram.