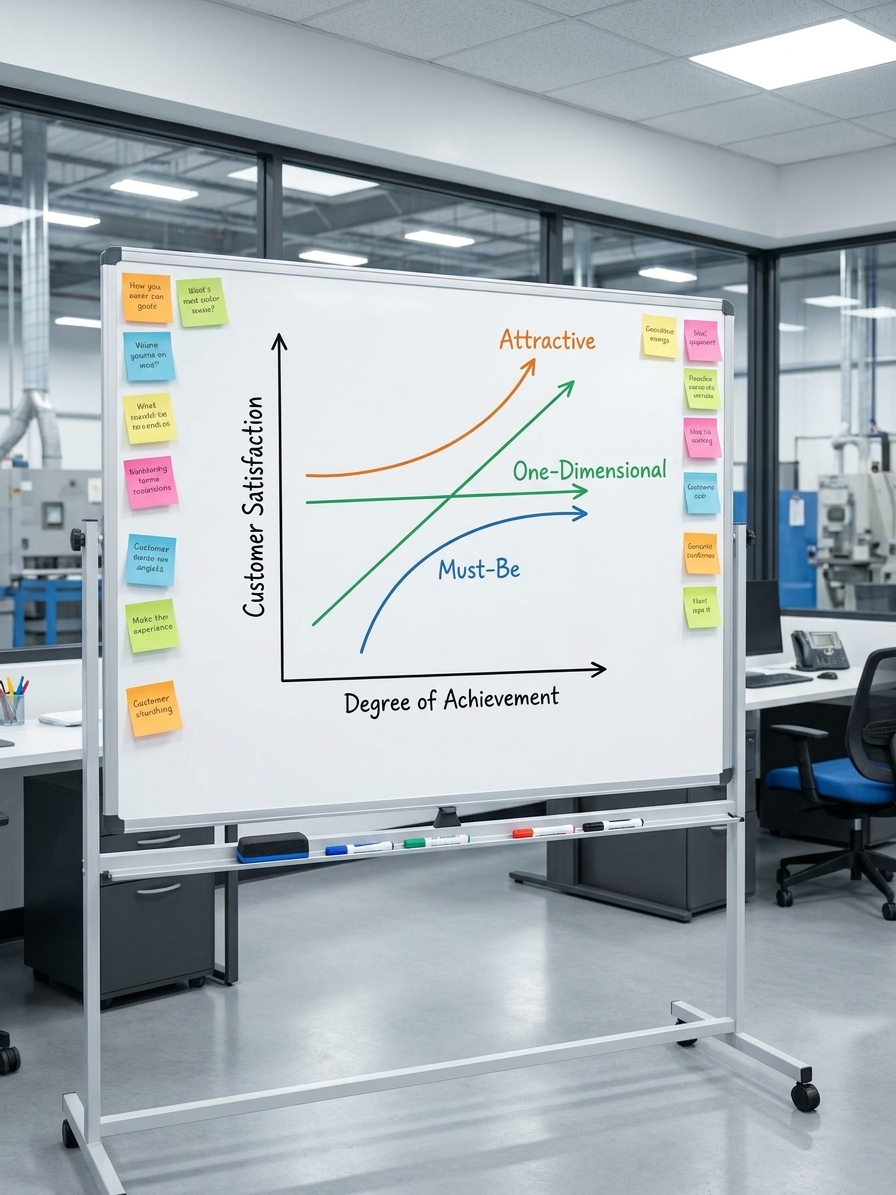
The most expensive quality system failures are designed in before production ever begins. When a Kano classification sits in a marketing deck rather than driving the Advanced Product Quality Planning timeline, the organisation has already committed its capital incorrectly. The engineering budget funds the wrong capability targets, and no amount of shop-floor inspection corrects a design-stage investment error.
Across two decades implementing and auditing quality management systems in automotive and aerospace, I have reviewed dozens of Kano studies. The methodology is usually defensible. The integration into quality planning is almost always absent. The classification does not reweight the PFMEA, does not set Cpk targets, and does not appear in the APQP gate criteria. The organisation paid for intelligence it never uses.
The financial damage compounds silently. At SNOP, where I built a greenfield QA/QC department for a 900-plus-employee automotive plant, I learned that resource allocation errors made during product development are an order of magnitude more expensive to correct than process variability caught during production. The design stage is where capital direction is set, and where the audit trail for Kano must begin.
Design-Stage Kano Integration vs the Standalone Study
During an audit, I request the traceability from Kano classification into quality planning documentation. What organisations provide is invariably a standalone market research deliverable. The cross-functional team built a valid dual-questionnaire, deployed it to a convenience sample, and produced a spreadsheet of attribute classifications. That spreadsheet was filed alongside the FMEA and never referenced again.
The administrative exercise was completed, but the output carries zero operational weight. The APQP gate reviews proceeded without referencing the classification. The PFMEA risk priority numbers were assigned through workshop consensus and historical defaults, not through a structured weighting based on customer-driven attribute categories. The engineering change prioritisation process continued to operate on internal politics and gut feeling.
This integration failure is the nonconformity. A classification that does not feed into gate reviews, that does not reweight RPNs, and that does not alter the engineering change prioritisation has produced no operational signal. The organisation has the data to make a better investment decision and has chosen not to act on it.
Standalone Study vs Capital-Allocation Driver
Standalone study
- Classification filed in a marketing or research deck after launch
- PFMEA RPNs set by historical defaults and workshop consensus
- Cpk targets assigned uniformly without reference to attribute type
- APQP gate reviews proceed with no Kano-weighted risk criteria
Capital allocation driver
- Classification directly weights PFMEA severity and occurrence scoring
- Must-Be features receive mandatory Cpk 1.33 minimum targets with funded SPC
- APQP gates require Kano traceability before releasing engineering capital
- Re-survey cadence of 12-18 months feeds back into the next design cycle
How Must-Be Classifications Must Reshape the PFMEA

The defining economic characteristic of a Must-Be requirement is that its failure cost is absolute. When an aerospace fastener fails torque specifications, it does not produce a marginal reduction in customer satisfaction. It generates a non-conformance report, a containment action under 8D methodology, and potentially a product recall. The premium cabin lighting that consumed the engineering budget is financially irrelevant to the cost of that recall.
To prove they are funding threshold reliability, organisations must show the statistical linkage at the design stage. I need to see which features are classified as Must-Be, the process capability targets assigned to those features, and the capital allocated to maintain those targets within the PFMEA and control plan. What I usually find is that innovative feature development is funded at a rate that dwarfs process capability studies, even as field return rates climb on threshold characteristics.
The risk profile is inverted by the design-stage budget. A single Must-Be failure in a controlled environment triggers a corrective action chain whose cost can erase the margin from an entire production run. Threshold defects generate warranty claims, logistics costs for replacement parts, and customer scorecard penalties. These are direct charges against operating profit, and the budget must reflect this asymmetry from the earliest design review.
No quantity of premium interior materials or advanced software features offsets the cost structure of a safety recall. Yet the investment pattern in most manufacturing organisations suggests the opposite. They systematically underfund threshold reliability because the internal logic of innovation treats it as solved. The PFMEA should make this misallocation visible before capital is committed, not after the field returns arrive.
The Reverse Category and Over-Engineered Specifications
Many manufacturing organisations default to treating all quality attributes as One-Dimensional during design-stage planning. Tighter tolerances, additional processing steps, greater material strength. The linear logic is seductive: if a Cpk of 1.33 satisfies the customer, a Cpk of 2.0 will satisfy them more. This logic ignores the Reverse category, where additional specification actively reduces satisfaction and increases cost.
As an auditor, I test this assumption by tracing the justification for tolerance tightening back to the design record. I ask for the Kano classification of the specific characteristic being pushed to higher capability. If the organisation cannot prove the feature is One-Dimensional, the tightening is economically unjustified. Past a certain threshold, more becomes worse in measurable financial terms.
Additional surface treatments add processing time, increase scrap rates, and introduce new failure modes. Additional sensors on a production line increase diagnostic overhead and false-positive rates, driving up overprocessing costs. Precision engineered past the point of customer value is not excellence. It is manufacturing confusion with a cost line.
The engineering hours spent pushing a tolerance past its peak of marginal satisfaction are capital that should have been allocated to a Must-Be process capability gap. The organisation pays for the additional processing, the additional inspection, and the additional scrap, while the customer derives no benefit. The gap between the cost incurred and the value delivered is a direct measure of misapplied quality capital.
Attribute Decay and the Design-Cycle Refresh Failure
Kano attributes migrate over time. What is Attractive today becomes One-Dimensional tomorrow and Must-Be the day after. Automatic emergency braking was a premium differentiator a decade ago, commanding premium pricing and driving brand perception. Today it is a baseline expectation. This lifecycle migration carries direct financial consequences that almost no organisation tracks during its design refresh cycles.
During an audit, I look for the re-administration cadence. The Kano Model requires periodic re-surveying every twelve to eighteen months to track classification shifts and redirect investment accordingly. Almost no organisation does this. Re-running the analysis has no champion and no budget. When I ask for the most recent classification update, the evidence trail usually goes cold after the initial product launch.
A Kano study that does not change resource allocation is a financial liability dressed as quality diligence.
Companies that treat Kano classifications as permanent consistently overinvest in features that have already migrated to baseline status. The internal classification, frozen at the moment of the original survey, still lists the feature as a differentiator. Engineering capital continues to flow into refining a specification the market already takes for granted. The return on that capital has dropped to zero, but the budget line remains active through every design iteration.
The decay tax compounds silently until a competitor launches a feature that exposes the misalignment. Meanwhile, competitors who understand attribute decay have already moved their engineering resources to the next innovation cycle. The company failing to track migration pays development costs for a feature generating no marginal revenue, while missing the window to create the next Attractive attribute for the upcoming platform.
Segmented Classification and the Tier-Specific Cost of Failure
Different customer segments classify the same attribute differently, and the financial consequences of getting this wrong during design are significant. What is a Must-Be threshold for a Tier 1 automotive OEM may be an Attractive differentiator for a Tier 2 supplier serving a different market segment. Organisations that run a single Kano analysis across all customer types misprice their requirements from the initial concept review.
When I audit supplier quality records, I look for segmented classification evidence. If a feature is classified as Attractive when the Tier 1 OEM customer treats it as Must-Be, the supplier has underinvested in its process capability at the design stage. The feature launches with marginal reliability. The Tier 1 customer issues a supplier scorecard penalty, triggering containment costs and potential line-down charges that dwarf the engineering investment saved.
Conversely, if a feature is classified as Must-Be when it is genuinely Attractive for a specific segment, the organisation overinvests in threshold reliability for a feature that could command premium pricing with less statistical rigour. The capital spent achieving Cpk 2.0 on a feature the customer experiences as a pleasant surprise is capital diverted from the Must-Be process gaps that generate real field returns.
Audit Indicators of Design-Stage Kano Misallocation
Building the Living Financial Instrument
Organisations that extract economic value from the Kano Model treat it as a continuous capital allocation discipline embedded in the design process. They re-survey the market on a fixed cadence. They track attribute migration and redirect engineering investment before the decay tax compounds. They maintain a roadmap not just for product features, but for the lifecycle stages and corresponding investment profiles of those features.
They resource threshold requirements with the same statistical rigour as their innovation pipeline, because the cost structure demands it. Must-Be reliability is not a lower priority than Attractive innovation. It is the financial precondition for everything else. A single threshold failure erases the margin from the entire product line. Effective organisations fund their process capability studies accordingly, treating Cpk targets on threshold characteristics as non-negotiable budget items.
The output of a Kano study must drive specific resource allocation decisions during APQP: what to innovate, what to maintain, what to cut. The findings feed directly into gate reviews, FMEA prioritisation, and the PPAP submission strategy. Effective organisations test for the Reverse category before pushing any specification tighter. They treat the model not as a satisfaction framework but as a financial instrument for identifying where the next unit of quality investment generates the highest return.
If the analysis does not change where engineering hours and capital are spent, the study was a waste of quality budget. The auditor's job is to find that gap between the data collected and the decisions made, and to report it as a material financial finding before the design is frozen and the capital is committed.