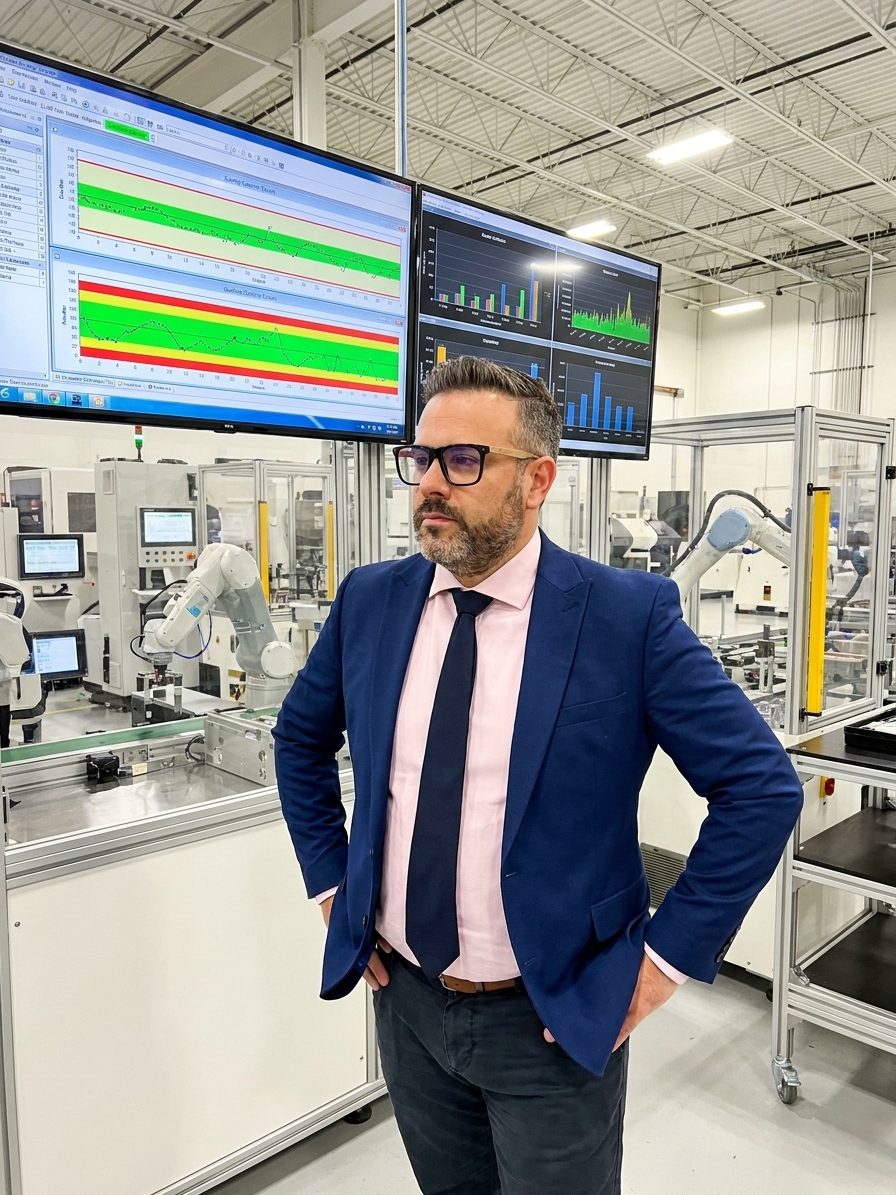
Two plants, same company, same IATF 16949 certification, same customer specifications. Over five years, one achieves Cpk values above 1.67 and becomes the preferred source for new launches. The other drops below 1.33, accumulates major nonconformities in every audit, and loses work to its sister facility. Both started from roughly the same baseline. Both had access to the same Lean Six Sigma toolkit and the same engineering talent pool.
This divergence is not a story about laziness or bad luck. It is the Matthew Effect — the principle that advantage accumulates and disadvantage compounds. Sociologist Robert K. Merton formalized the concept in 1968 to describe how eminent scientists receive disproportionate credit for collaborative work while lesser-known contributors receive none. The same dynamic operates with brutal precision in manufacturing quality, where early advantages in process capability, talent, and culture feed on themselves until the gap becomes structurally unbridgeable.
I have audited multi-plant networks where the performance gap between the best and worst facilities exceeded 300% on the same product lines. Understanding the Matthew Effect is not an academic exercise. It is a diagnostic framework that reveals why standard improvement programmes fail in struggling operations — and identifies the specific intervention points where quality leadership can reverse the compounding dynamic.
How Advantage Accumulates Across Four Dimensions
The Matthew Effect in quality is not a single event but a self-reinforcing feedback loop operating across talent, capital, customer relationships, and culture simultaneously. A plant that achieves strong PPM performance becomes a destination for top engineering talent. High-potential new hires request transfers there. Interns who rotate through it come away impressed and campaign to return. The plant grows smarter and more capable, which strengthens its reputation further and attracts even better candidates in the next hiring cycle.
Meanwhile, the plant with quality problems becomes a place people want to leave. Its best engineers transfer out at the first opportunity. Management, seeing the deterioration, assigns weaker supervisors — which accelerates the decline. Institutional knowledge drains faster than it can be rebuilt. Every departure takes with it undocumented process knowledge that the remaining team cannot recover, and the next quality escape traces directly back to that lost expertise.
Capital allocation follows the same pattern. A plant with excellent OEE and low scrap rates makes a compelling case for new equipment, automation, and process upgrades. The investment improves quality further, generating better metrics that justify the next budget cycle. The plant modernizes continuously. The struggling plant faces budget cuts because finance cannot justify investing in an underperforming operation. It is told to improve with what it has — aging equipment, manual inspection, and workarounds that generate the very defects used to deny its funding requests.
Customers reinforce the cycle. They share more information, collaborate on APQP, and provide earlier access to new programmes for high-quality suppliers. The strong plant gets a head start on every launch. The weak plant loses work or gets relegated to low-margin, high-tolerance jobs. Customers audit it more aggressively, demand more concessions, and leave no capacity for the preventive work that would actually improve performance.
The Compounding Mathematics of Quality Capital
What makes the Matthew Effect insidious is that it operates through compounding. Consider two plants that start with a quality difference of just 2% in their defect rates. Plant A runs at 1% defects; Plant B runs at 3%. Both implement continuous improvement at the same 10% annual reduction rate. After one year, Plant A is at 0.9% and Plant B is at 2.7%. The absolute gap has narrowed slightly, but the simple arithmetic masks what is actually happening on the shop floor.
The improvement at Plant A freed up resources — less rework, fewer 8D investigations, simpler material flow — that engineers can now reinvest in preventive projects like predictive maintenance and advanced SPC. The improvement at Plant B, while real, still leaves the plant operating in firefighting mode. Plant A can afford to assign its best engineers to work on Poka-Yoke and machine capability studies. Plant B needs those same engineers just to manage the backlog of open corrective actions and contain the next customer complaint.

The Five-Year Compounding Gap
Over five years, Plant A has accumulated five years of improvement infrastructure — trained operators, established PFMEA disciplines, refined process flows, tested measurement systems. Plant B has accumulated five years of Band-Aid fixes, deviation requests, and institutional fatigue. The same rate of improvement produces radically different outcomes depending on where you start. This is why copying a world-class plant's visible practices without its accumulated capital fails every time.
Why Benchmarking and Standard Tools Miss the Dynamic
Most quality management frameworks treat each plant and each problem as an independent challenge. Apply the right toolkit — Six Sigma, 8D, FMEA, MSA — and you will get the right results, regardless of context. This assumption is fatally flawed because it ignores the accumulated capital that determines whether those tools can be effectively deployed in the first place.
A plant with deep quality capital can implement a new SPC system across its critical characteristics in weeks. Operators already understand control charts, supervisors already use the data in daily meetings, and the measurement systems are already validated through prior MSA studies. A plant with shallow quality capital might struggle for months just to get consistent data collection, because the gauges are uncalibrated, the operators are not trained on data entry, and the supervisors do not trust the numbers long enough to act on them.
This is why benchmarking exercises fail repeatedly. A team from a struggling plant visits a world-class facility, documents its Andon system, its layered process audits, its daily quality meetings, and returns home to replicate what they saw. The implementation falls flat within months. The visitors conclude that the practices do not work here, when the truth is that they are trying to copy the visible outputs of years of accumulated advantage without any of the underlying training, trust, or institutional learning that makes those practices effective.
Breaking the Negative Spiral: Four Intervention Points
The Matthew Effect is powerful but it is not immutable. Breaking a negative quality spiral requires interventions that directly address the compounding dynamics rather than the surface symptoms. Standard root-cause analysis will tell you that a plant has a training problem or an equipment problem. It will not tell you that the training problem exists because talent left and was never replaced, or that the equipment problem exists because capital was diverted to the stronger plant for three consecutive budget cycles.
The most powerful lever is asymmetric capital investment — deliberately directing disproportionate resources to struggling operations. This feels counterintuitive to finance departments that allocate based on demonstrated return. But if the Matthew Effect is active, the highest-return investment is often in the operation that appears to offer the lowest returns, because breaking the negative spiral unlocks compounding improvement that far exceeds the incremental gains from polishing an already-strong plant.
Talent redistribution is equally critical. Assigning your strongest quality professionals to your weakest operations — and framing those assignments as prestigious rather than punitive — directly attacks the talent spiral. Some of the most effective organisations I have worked with created formal quality turnaround teams with executive visibility, dedicated resources, and explicit career advancement incentives for participants.
The tool is the same. The accumulated capital that determines whether it succeeds is completely different.
Reversing the Negative Spiral
- 01Asymmetric investmentDirect capital to the weakest plant first — equipment that removes human error and stabilises the process
- 02Talent redistributionAssign top engineers on prestigious turnaround terms, not as punishment detail
- 03Customer reallocationPair the plant with a collaborative customer; temporarily route adversarial accounts to stronger sites
- 04Cultural inoculationEngineer visible early wins to break the narrative of inevitable failure
- 05Sustained compoundingOnce the spiral reverses, natural improvement dynamics begin working in the right direction
Customer relationship reset provides the breathing room. Temporarily assigning demanding customers to stronger plants while the weaker operation builds capability is not a concession — it is a strategic reallocation. Formal plant-customer partnerships, where the customer commits to working through the improvement journey in exchange for long-term supply agreements, create a virtuous cycle. The customer's patience gives the plant space to improve, the improvements strengthen the relationship, and the strengthened relationship supports further investment.
Cultural Inoculation and the Engineering of Visible Wins
Breaking the culture spiral requires a fundamentally different approach to improvement prioritisation. In a plant where people believe that good quality is simply not achievable, you do not start with the most important problem or the largest cost driver. You start with the problem most likely to be solved quickly and visibly. The goal at this stage is not the magnitude of the improvement. It is the demonstration that improvement is possible at all.
Each visible win challenges the narrative of inevitable failure. A team that solves a chronic dimensional issue, even a minor one, begins to believe that the next problem is also solvable. Cultural capital accumulates in the same way that technical capital does — slowly at first, then with accelerating momentum. The shift from we tried everything to we solved that one, so let us look at this one is the inflection point where the compounding dynamic reverses direction.
This requires discipline from leadership. The temptation in a struggling plant is to launch a massive transformation programme that addresses every problem simultaneously. That approach fails because it spreads already-thin resources across too many fronts and produces no visible wins fast enough to change the culture. Pick one line, one defect, one measurable target. Solve it. Celebrate it. Then pick the next one. The pace will feel agonisingly slow to executives who want quarterly results, but it is the only approach that builds the cultural foundation required for sustained improvement.
The Leadership Mandate: Managing Trajectory, Not Just Metrics
The Matthew Effect places a specific burden on quality leadership. If you are responsible for multiple plants, you must resist the temptation to focus attention where results are easiest to achieve. The plants that are performing well do not need your intervention — they have momentum and the compounding dynamic is already working in their favour. The plants that are struggling need you most, and they need targeted interventions that address the specific spiral they are caught in.
This requires a different kind of assessment. Instead of asking what the current defect rate is, ask what the trajectory is. A plant with a 2% defect rate that has been improving 15% annually for two years is in a fundamentally different position than a plant with the same 2% that has been flat for three years. The first is accumulating advantage. The second is accumulating frustration, and if nothing changes, the numbers will eventually reflect it — usually during a customer audit or a launch crisis.
Leadership also means protecting high-performing operations from the complacency that the Matthew Effect can breed in reverse. Past success generates overconfidence. Overconfidence leads to skipped layers of process audits, relaxed discipline on PFMEA reviews, and the assumption that the current Cpk will sustain itself without continued investment. The history of manufacturing is full of plants that were once considered world-class and are now closed. The advantage accumulated — and so did the assumption that it would always be there.
Quality leadership is fundamentally about managing compounding dynamics. It is about ensuring that advantages accumulate and that disadvantages are interrupted before they become structural. The plants that got better kept getting better because someone, at a critical moment, directed investment and talent toward the intervention that set the compounding in the right direction. The plants that fell behind did so because no one intervened until the gap was too wide to close with standard tools.