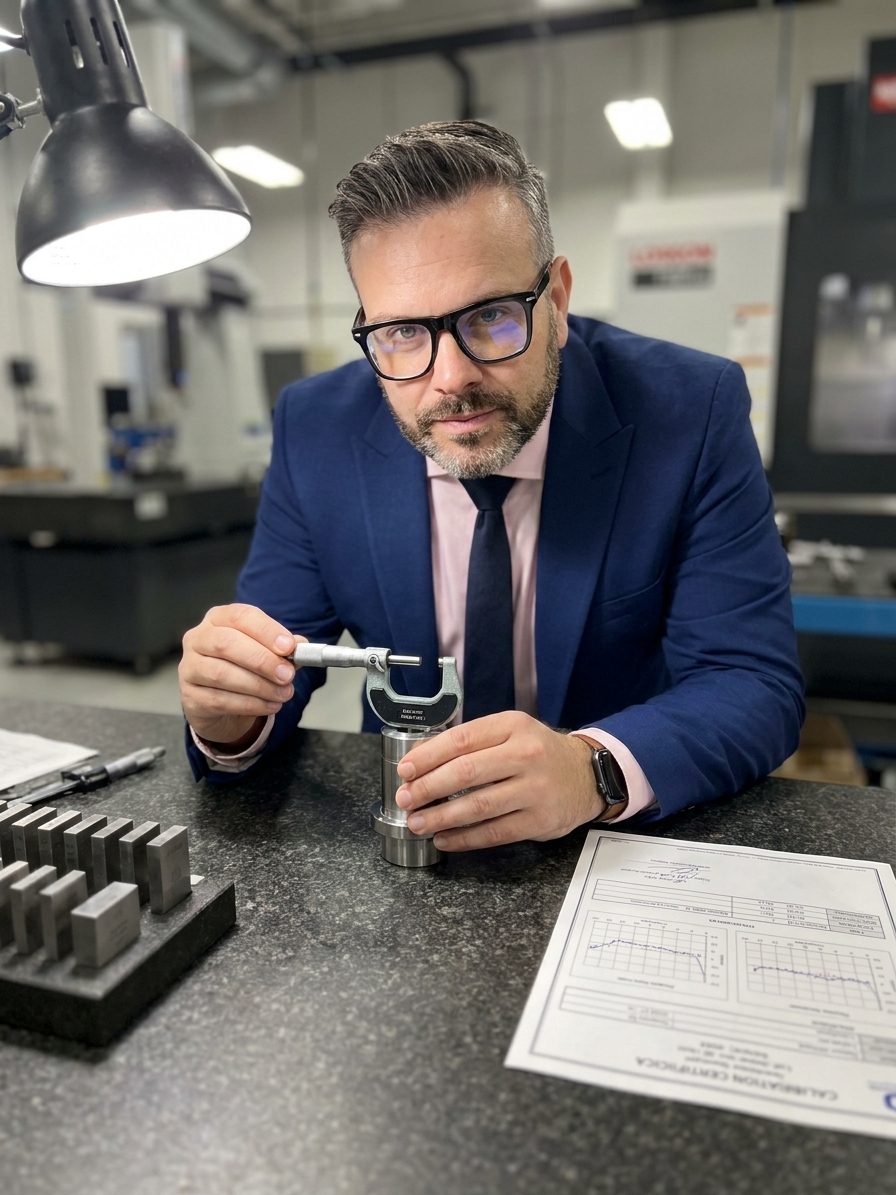
Every manufacturing engineer knows the routine. You run a Gage R&R study, the numbers come back under 10%, everyone nods approvingly, and the study gets filed away in a PPAP binder. Meanwhile, on the production floor, one operator measures a critical dimension and gets a pass. A second operator measures the same part and rejects it. Your perfectly compliant Gage R&R study offers zero help in resolving the dispute.
This is the Measurement System Analysis paradox. The tool designed to tell you whether you can trust your measurements has become a ritual organizations perform to feel confident about data they should not trust. The study passes, the IATF 16949 or AS9100 auditor is satisfied, but the measurement system remains broken. You spent three days proving something that simply isn't true.
MSA is the discipline of understanding how much of the variation you observe in your process data comes from the process itself, and how much comes from the act of measuring it. Total observed variation equals process variation plus measurement variation. If your measurement variation is large relative to your process variation, you are making decisions based on noise. You are rejecting good parts, accepting bad ones, and you have no mechanism to distinguish between the two.
The Gap Between Study Conditions and Production Reality
When you conduct a Gage R&R study, you create an artificial environment. You select parts that deliberately span the expected range. You select operators who are trained and available. You conduct the study in a controlled metrology lab with stable temperature and minimal vibration. You use a gage that was calibrated that morning, and you give operators unlimited time to measure carefully.
None of these conditions survive on the production floor. Operators measure parts at line speed. The gage has taken a beating on the line for weeks. Temperature swings between shifts affect both the part and the equipment. Fixtures wear, lighting changes, and parts are presented in different orientations. The production pressure of a backing-up line forces operators to rush that fifth reading.

Your study tells you how good your measurement system can be under ideal conditions. It does not tell you how good it is on a Tuesday afternoon when everything is going wrong. Treating a laboratory result as a description of production reality is a fundamental error. It is the difference between a measurement system that actually works and one that merely passes a test.
MSA Study Environment vs Production Reality
Study Conditions (Artificial)
- Lab-controlled temperature
- Recently calibrated gage
- Unhurried, careful measurement
- Hand-picked parts spanning tolerance
Production Reality (Actual)
- Ambient floor temperature swings
- Gage subjected to daily wear
- Cycle-time pressure and fatigue
- Consecutive parts with natural drift
Percentage of Tolerance vs. Percentage of Variation
There are two ways to express Gage R&R, and choosing the wrong one invalidates your analysis. You can calculate Gage R&R as a percentage of total variation, dividing system variation by total process variation. Alternatively, you can calculate it as a percentage of tolerance, dividing system variation by the tolerance range. These formulas yield dramatically different results depending on your process capability.
If your process is highly capable, with a Cpk above 2.0, your total process variation is tiny relative to the specification limits. A measurement system that consumes 30% of your process variation might consume only 5% of your tolerance. The study passes comfortably by the tolerance method, yet fails decisively by the variation method. Most organizations simply pick the metric that delivers the passing result.
The choice of metric must match the decision the measurement supports. If you use the data for process control, such as SPC charts, you must evaluate against process variation. Measurement noise masks real process shifts. If you use the measurement for final inspection and pass/fail decisions against a specification, you evaluate against tolerance. Selecting the favorable calculation is not analysis. It is shopping for a number.
The Ignored Elements: Bias, Linearity, and Stability
Gage R&R studies dominate because they produce a single percentage that fits neatly into a customer report. But the AIAG MSA manual defines additional characteristics that dictate whether your data reflects reality. Bias measures whether your system consistently reads higher or lower than the true reference value. If a caliper consistently reads 0.003 mm high, every part is judged against a shifted standard. Your R&R could be flawless, and your shipping decisions would still be wrong.
Linearity evaluates whether that bias changes across the measurement range. A micrometer might be perfectly accurate at 10 mm but read 0.008 mm high at 25 mm. If you only validate bias at a single nominal value, you will never catch this drift. Stability requires tracking the measurement system over time using control charts on reference standards. A gage that drifts 0.01 mm per month renders your January study useless by June.
Running a Gage R&R and ignoring bias, linearity, and stability is like getting a full medical checkup and only looking at your weight. The AIAG manual is explicit about these requirements. Ignoring them because they complicate the paperwork means your measurement system is fundamentally unvalidated. You are assuming accuracy in a system you have only tested for precision.
Core MSA Characteristics Beyond R&R
Attribute Gage Studies and the Human Eye
A massive portion of automotive and aerospace inspection relies on visual judgments: scratch evaluation, burr presence, colour match, and weld appearance. Attribute Gage R&R studies attempt to quantify the reliability of these inspections using Attribute Agreement Analysis. Multiple operators evaluate the same set of parts multiple times. The study inevitably reveals that your visual inspection system has 65-75% agreement on borderline parts.
The fix for visual inspection disagreement is better boundary samples, not more Gage R&R studies.
The corrective action for this disagreement is never another study. You cannot calibrate a human eye the way you calibrate a micrometer. The resolution requires physical standards: boundary samples, master defect cards, improved lighting, and magnification. It requires clear, unambiguous visual criteria. But the MSA study is what gets run repeatedly because the study is what the auditor demands.
Recognize that attribute systems are fundamentally different from variable systems. Visual inspection will always produce disagreement on true borderline cases, because borderline literally means reasonable professionals can disagree. Investing in physical standards and operator training is the only mechanism that improves attribute agreement. Running the same calculation on the same flawed criteria wastes engineering resources.
How Sample Selection Manipulates the Outcome
A Gage R&R study requires sample parts that represent the expected process variation. This selection is subjective, and it has enormous influence on the outcome. If you select parts that cluster tightly around the nominal dimension, your total observed variation will be extremely small. The fixed measurement variation will look disproportionately large by comparison. The Gage R&R percentage spikes, and the study fails.
Conversely, if you deliberately select parts that span a wide range, including outliers near the specification limits, your total observed variation becomes large. The same fixed measurement variation suddenly looks tiny. The Gage R&R percentage drops, and the study passes. Same operators. Same gage. Same measurement variation. Different parts. Different result.
The study is not an objective scientific instrument. It is highly sensitive to sampling bias. I have audited plants where the engineer selecting the parts knows exactly what result is needed to close the PPAP. When the sample selection is engineered to produce a passing metric rather than to represent production reality, the resulting percentage is fiction. It proves the math works, not that the system is capable.
Building a Genuine MSA Program
Organizations that actually use MSA, rather than perform it, understand the difference between capability and compliance. They study measurement systems before trusting them, not after. Before a new gage touches the production floor, they understand its limitations. They know exactly where the gage is strong and where it breaks down under stress. They do not wait for an external audit to discover their measurement system is inadequate.
A genuine program tracks stability over time using control charts on reference masters. They monitor bias week by week and identify gage drift before it corrupts production decisions. When a study reveals inadequacy, they invest in better fixturing, better methodology, or automated vision systems. They do not manipulate the part sample to artificially lower the percentage until the calculation passes.
The root cause of MSA theatre is treating measurement as overhead rather than a core technical competency. Plants invest heavily in automation and tooling, then specify the cheapest available gage and run a study to confirm it functions. This is backwards. The measurement system is the lens through which you see your process. If that lens is distorted, every Cpk calculation, every 8D root cause, and every scrap decision is compromised.
The measure of a reliable system is whether operators trust it enough to make real decisions with the data. When someone hands you a passing Gage R&R, do not just check the percentage. Ask when the study was conducted, what environmental conditions were used, and who selected the parts. If the answers make you uncomfortable, you have found the actual value of the study. Everything else is just paperwork.