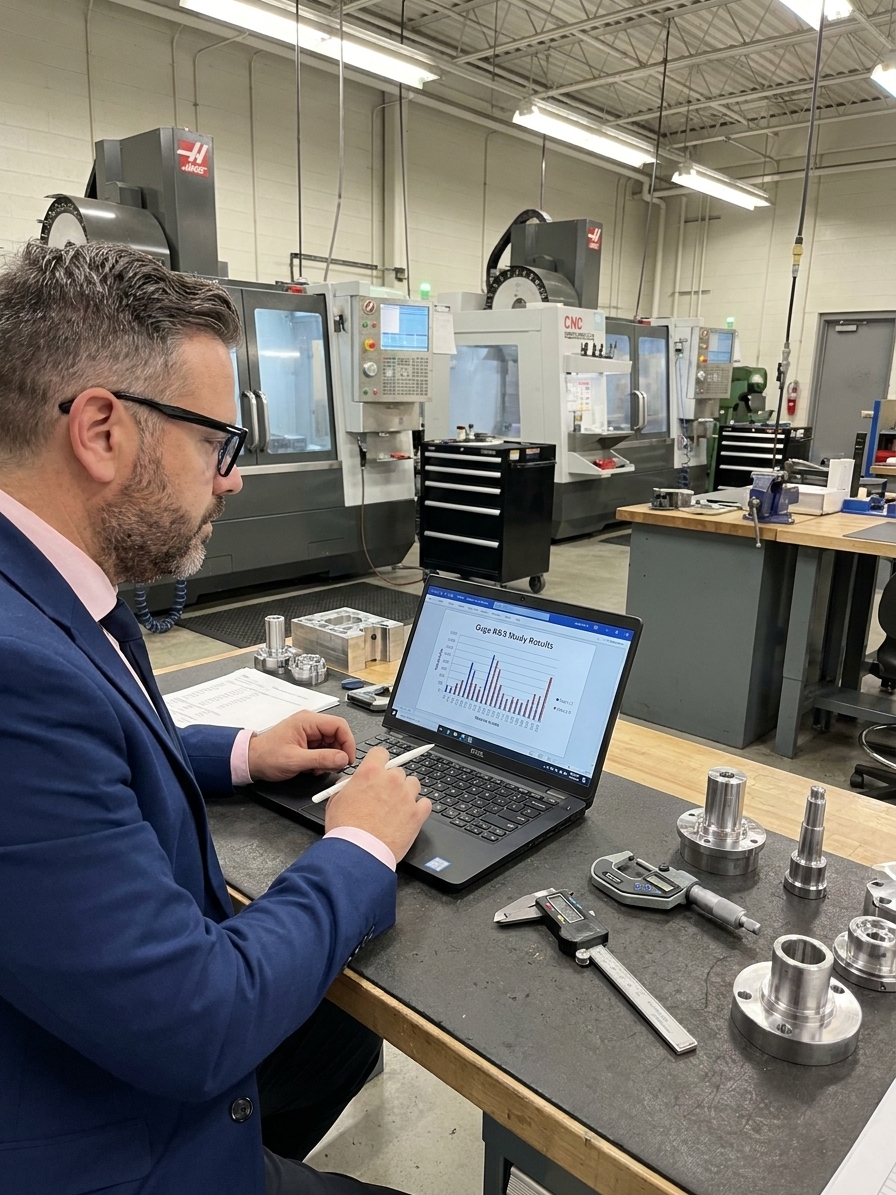
A quality engineer walks into the Monday review, slides a Gage R&R report across the table, and announces the result is under 10%. The plant manager nods. The auditor checks the box. Everyone feels confident in the measurement system. But nobody asked how that number was produced.
Who selected the parts? Were they pulled from a representative production sample, or hand-picked to span the full tolerance range and artificially deflate the error percentage? Were the operators chosen because they routinely perform the measurement, or because they were available? Was the study done once, years ago, and filed away as a PPAP artifact?
Measurement Systems Analysis (MSA) is the most misunderstood tool in quality management. It is not conceptually difficult. It is misunderstood because organisations treat it as a paperwork requirement for IATF 16949 or AS9100, rather than what it actually is: the foundation upon which every other quality decision rests. If you cannot trust your measurements, you cannot trust your control charts, your Cpk calculations, or your defect rates.
The Illusion of Precision
I have audited plants where a precision machining operation runs tolerance bands of +/-0.015 mm. The company invested in digital calipers reading to 0.001 mm. Everyone felt confident because the instrument displays three decimal places. The quality team ran SPC charts on the data and calculated capability indices to make acceptance decisions.
Then someone ran a proper Gage R&R study. The measurement system variation was nearly 40% of the total tolerance. For parts near the specification limit, the measurement system alone was causing good parts to be rejected and bad parts to be accepted. The digital display was an illusion. The instrument was precise — it displayed fine increments — but the overall measurement process lacked the accuracy to distinguish good from bad product.
Precision of display does not equal accuracy of measurement. A digital readout showing 12.527 mm feels authoritative. But if the system has high R&R, that number could be 12.52 or 12.53 depending on who held the caliper and how they positioned it. The third decimal place is theatre. A calibrated instrument in a poor measurement system produces calibrated garbage.

The Five Characteristics Most Plants Ignore
When an inspector measures a part and records 12.52 mm, that number is not pure truth. It is a composite of the part's true value, the bias of the instrument, and the variation introduced by the act of measuring. MSA decomposes that composite. It quantifies how much noise your measurement system adds to the signal.
The most common study is Gage Repeatability and Reproducibility (Gage R&R). But MSA encompasses more than R&R. A complete analysis examines five distinct characteristics. Most organisations do R&R studies. Far fewer do bias, linearity, and stability studies. That gap is where the trouble begins.
Bias tells you whether your gage reads systematically different from a known standard. Linearity shows whether that bias changes across the measurement range. Stability tracks whether the bias changes over time. Repeatability tests if the same operator gets the same result on the same part. Reproducibility tests if different operators get the same result.
| Characteristic | What It Measures | Typical Practice |
|---|---|---|
| Repeatability | Same operator, same part, multiple trials | Usually tested |
| Reproducibility | Different operators measuring the same part | Usually tested |
| Bias | Systematic deviation from a reference standard | Rarely tested |
| Linearity | Bias consistency across the measurement range | Almost never tested |
| Stability | Bias drift over time under real conditions | Almost never monitored |
Designing a Gage R&R That Cannot Be Gamed
A Gage R&R study that produces trustworthy results requires careful design. Part selection is where most studies go wrong. The parts must represent the actual production variation of the process. If you select parts that are all nearly identical, the study will show terrible R&R results because there is no part-to-part variation to detect against.
Conversely, if you deliberately select parts spanning the full tolerance range, including some deliberately out of specification, you inflate the part variation and make the R&R look artificially good. The correct approach is to sample parts from the actual production process over a representative period. Take them from different shifts, machine cycles, and times of day. Let the process speak for itself.
Select at least two to three operators who routinely perform this measurement. Do not grab your best inspector and two experienced engineers. Use the people who actually do the work, because their variation is what matters in production. Each operator should measure each part two to three times, in randomised order. Randomisation prevents operators from remembering previous readings. If you hand the same part to the same operator three times in a row, they will unconsciously match their previous answer. That tests memory, not the measurement system.
Conduct the study in the actual production environment, not in the climate-controlled quality lab. If the measurement happens on the shop floor, the study must include shop floor conditions: temperature variation, vibration, lighting, and time pressure. A study done in ideal conditions tells you what your measurement system could do in theory. A study done in production tells you what it actually does.
Anatomy of a Defensible Gage R&R Study
- 01Sample Parts from ProductionPull from actual runs across different shifts; do not hand-pick to game the tolerance spread.
- 02Select Routine OperatorsUse the personnel who normally perform the measurement, not senior engineers.
- 03Randomise and Blind the TrialsPrevent operators from remembering previous readings or knowing which part they measure.
- 04Execute on the Shop FloorRun under actual environmental conditions rather than inside a controlled lab.
Interpreting the AIAG Acceptance Bands
The AIAG standard classifies Gage R&R results into three bands based on the percentage of study variation or tolerance consumed. Under 10%, the system is acceptable. It contributes little variation relative to the process tolerances, and you can trust the data it produces for SPC and capability analysis.
Between 10% and 30%, the system is marginal. It may be acceptable depending on the application, the cost of the measurement, and the risk of misclassification. If the measurement drives a safety-critical characteristic under FDA or EASA oversight, marginal is not good enough. If it is a general dimension with generous tolerance, marginal might be fine.
A 6% R&R from a poorly designed study is worse than a 25% R&R from a well-designed one. At least with the latter, you know you have a problem.
Over 30%, the system is unacceptable. Decisions based on this system are unreliable. You are likely accepting bad product and rejecting good product regularly, and you have no way of identifying which past decisions were wrong. The percentage is only as honest as the study that produced it.
The Missing First Step and Attribute Gaps
Before running a full Gage R&R, run a Type 1 Gage Study. One operator measures a single calibrated reference part at least 25 times. The results reveal bias against the known reference value, basic repeatability, and the Cpk of the measurement process itself. If the Type 1 study shows significant bias or poor repeatability, there is no point in running a full R&R. Fix the instrument first.
The number of organisations skipping this step and going straight to R&R is staggering. They run a complex crossed study with multiple operators and parts, generate an impressive statistical report, and never notice the basic instrument is biased. It is like building a second floor on a house without checking the foundation.
Most Gage R&R discussion focuses on variable data, but many systems are attribute-based: pass/fail, go/no-go, visual inspection. Attribute systems are consistently underestimated as sources of error. The classic study involves 30 parts, two to three inspectors, and two trials each. The parts must include borderline cases, not obviously good or bad parts.
Variable vs Attribute MSA Realities
Variable Data (Continuous)
- Output is a specific numerical value on a scale
- Gage R&R uses ANOVA to separate part and system variation
- Errors are quantified against tolerance bands
- AIAG bands dictate clear 10% and 30% action thresholds
Attribute Data (Pass/Fail)
- Output is a binary classification requiring signal detection theory
- Effectiveness measured by miss rate and false alarm rate
- Borderline parts expose inspector agreement as low as 60%
- No standard alarm threshold prompts action before field returns
Stability and the Hidden Cost of Drift
A Gage R&R study is a snapshot. It describes the measurement system on the day of the study, with the operators who participated, using the instrument as it was calibrated then. But measurement systems drift. Instruments wear. Operators leave. Environmental conditions shift with the seasons. A system acceptable in January might be unacceptable by July, and nobody will know because the study was filed away.
The solution is to run control charts on a reference standard. Measure a known reference part once a day, week, or month, and plot the result on an X-bar/R chart. When the chart shows a trend or out-of-control point, the measurement system has changed. This stability study is the only MSA component providing ongoing assurance. Bias, linearity, and R&R are point-in-time studies. Stability is the continuous monitor that tells you whether previous results remain valid.
Measurement error imposes hidden costs. False rejects scrap perfectly good product. False accepts ship nonconforming parts to customers. Over-control occurs when operators see measurement noise and adjust a stable process, adding variation that would not exist if the data were trusted less. Inflated capability indices result when measurement variation inflates total variation, making a capable process look incapable and triggering unnecessary equipment purchases.
ISO 9001 requires organisations to provide resources ensuring valid and reliable monitoring results. Auditors check calibration records meticulously. But calibration alone does not guarantee valid results. Calibration tells you the instrument was correct on the day it was checked. It says nothing about repeatability, reproducibility, bias across the range, or stability over time. The gap between what the standard intends and what audits verify is where measurement systems hide their failures.