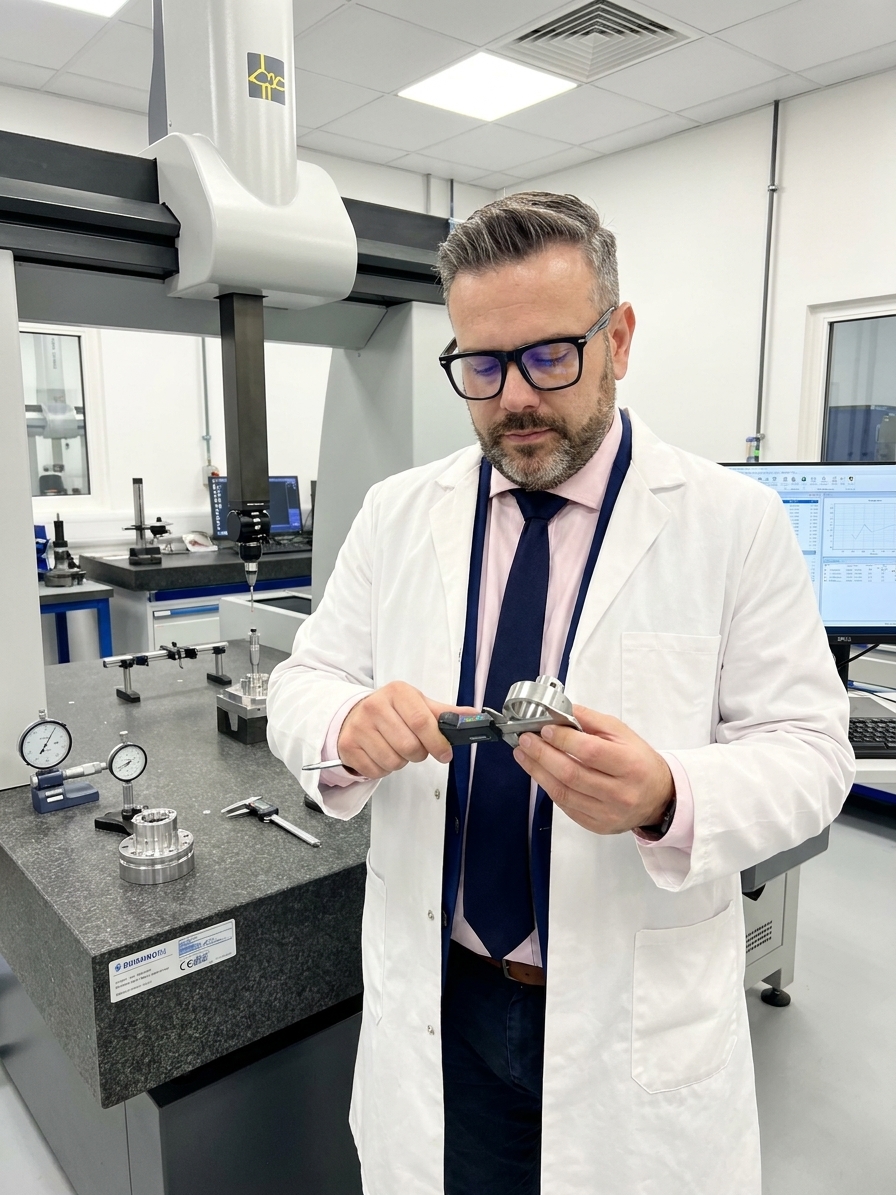
Your coordinate measuring machine reports a critical shaft diameter at 24.987 mm. The specification calls for 25.000 mm with a tolerance of ±0.020 mm. The part conforms. You ship it. Your customer measures the same part at 25.031 mm and rejects the lot. An engineer spends three days writing an 8D report, you issue a containment action, and two weeks later you discover the truth: neither measurement was correct. Your CMM was reading low, their gauge was reading high, and the actual dimension was comfortably in spec.
What failed was not the manufacturing process. The measurement system failed. This blind spot exists inside almost every quality organization. Plants spend vast resources controlling processes and analyzing defect data while building SPC charts and calculating capability indices. They assume, entirely without verification, that the raw numbers feeding those high-level analytical systems are fundamentally correct.
Measurement System Analysis forces an uncomfortable question: before you trust your production data, how much of the observed variation belongs to the physical part, and how much belongs to the measurement system itself? In my experience auditing plants across automotive and aerospace, the answer is often horrifying. More than half of measurement systems initially submitted for review are generating data that is mostly noise.
The Difference Between Calibration and MSA
Most engineers confuse MSA with calibration. Calibration verifies that an instrument reads correctly against a known traceable standard in a controlled environment. MSA evaluates whether the entire measurement system produces trustworthy data on the shop floor. The system includes the gauge, the operator, the measurement method, the environmental conditions, and the specific geometric interaction between the probe and the part.
Consider a digital micrometer perfectly calibrated in a metrology lab. On the production line, worn anvils introduce radial play. An operator applying varying ratchet force generates inconsistent readings. Ambient temperature fluctuations cause thermal expansion in the measurement frame. The gauge is technically calibrated, yet the measurement system is entirely untrustworthy.
MSA mathematically decomposes total observed variation into actual part variation and measurement system variation. When measurement system variation consumes thirty percent or more of your total observed tolerance, you are no longer measuring your manufacturing process. You are exclusively measuring your measurement system.
At that threshold of error, every control chart plotted with that gauge becomes a random walk. Every calculated capability index is fictional. In the automotive supply chain, reporting a PPAP requirement of Cpk 1.33 using data from an unvalidated gauge is not simply inaccurate. It represents a systemic failure of your IATF 16949 quality management system.

The Gage R&R Study as a Stress Test
The core statistical tool of MSA is the Gage Repeatability and Reproducibility study. The methodological design is strict. You select ten production parts that span the full range of expected process variation. You assign three operators who routinely perform the inspection. Each operator measures each of the ten parts three separate times, in randomized order, while blind to previous readings.
This matrix generates ninety distinct data points. Statistical analysis decomposes those ninety numbers into specific variation components. Repeatability isolates the inherent mechanical error of the gauge itself. Reproducibility isolates the operational variance introduced by different human inspectors. The AIAG MSA manual provides rigid acceptance criteria based on the resulting percentage of study variation.
If the resulting GRR percentage falls under ten percent, the system is acceptable for production decisions. A result between ten and thirty percent is marginal. It may pass for non-critical characteristics, but it will fail to detect meaningful process shifts on tight aerospace tolerances. Anything above thirty percent renders the measurement system unacceptable for process control.
AIAG Acceptance Criteria for Gage R&R
I have audited measurement systems feeding critical data to customers that initially returned GRR results well above fifty percent. Nobody in those organizations intentionally deployed a broken system. They simply calibrated the hardware annually and assumed the production data was valid. The failure was structural, born of ignorance regarding the difference between hardware calibration and system validation.
The Cascade Cost of Unanalyzed Systems
Unanalyzed measurement systems actively destroy profitability in ways that mimic process failures. When a measurement system generates false rejects, the plant scraps conforming product. I once worked with a manufacturer scrapping twelve percent of production based on a laser micrometer reading. A subsequent Gage R&R study proved the gauge operated at forty-five percent GRR due to a fixture alignment issue. The fix cost a fraction of the annual scrap value.
False accepts are arguably worse. The system allows nonconforming product to pass inspection. In aerospace machining, a false accept on a turbine disc dimension is not merely a quality excursion; it is a severe airworthiness safety issue. AS9100 and NADCAP accreditation requirements explicitly demand rigorous measurement system control to prevent exactly this scenario.
When measurement noise infiltrates data, it triggers SPC paralysis. Control charts trigger out-of-control signals regardless of actual process stability. Engineers waste weeks chasing non-existent assignable causes. Because the organization never quantified the baseline measurement error, they cannot distinguish between true process drift and gauge variation. Continuous improvement resources burn out on ghost hunts.
A measurement you haven't validated isn't a measurement. It's an opinion with a number attached.
Supplier disputes frequently originate in unanalyzed measurement systems. Incoming inspection rejects a lot. The supplier re-measures and accepts it. Both companies waste time and money escalating the disagreement to a neutral third-party laboratory. The investigation invariably reveals that both the customer's and supplier's gauges suffer from unanalyzed bias or linearity errors. The parts were fine; the measurement systems were broken.
Diagnosing the Big Five Error Types
MSA does not simply assign a pass or fail grade to a gauge. It provides a diagnostic map of where the system breaks down. The AIAG manual defines five distinct categories of measurement error: bias, linearity, stability, repeatability, and reproducibility. Each category points to a specific mechanical or operational failure mechanism requiring targeted corrective action.
Bias and linearity errors indicate the gauge reads consistently high or low, or that its accuracy drifts across the measurement range. These typically require recalibration, physical adjustment of the equipment, or software offset compensation. Stability errors reveal system drift over time, highlighting the need for tighter environmental control or more frequent intermediate verification checks between formal calibrations.
Repeatability errors almost always point to mechanical degradation. Worn contact surfaces, loose clamping fixtures, excessive spindle play, or inadequate digital resolution relative to the engineering tolerance cause repeatability failure. Reproducibility errors highlight human inconsistency. Fixing a reproducibility failure requires standardizing the measurement procedure, mistake-proofing the fixture, and retraining operators.
| Error Category | Primary Root Cause | Required Corrective Action |
|---|---|---|
| Repeatability | Hardware wear, fixture looseness | Repair or replace gauge mechanism |
| Reproducibility | Operator technique variance | Mistake-proof fixture, update SOPs |
| Bias / Linearity | Calibration drift across range | Recalibrate, apply software offset |
Understanding these categories prevents expensive misdiagnosis. Retraining operators will not fix a repeatability problem caused by a worn micrometer anvil. Conversely, purchasing a fifty-thousand-dollar automated CMM will not fix a reproducibility problem if the underlying fixture locates the datum target inconsistently. The MSA data dictates the precise engineering response required.
Validating Attribute Inspection Systems
Attribute data presents a profound MSA challenge. Visual inspection and functional gauging systems generate pass or fail decisions rather than continuous variables. Attribute agreement analysis evaluates inspector consistency using a baseline set of known reference parts, including borderline samples. It measures within-appraiser agreement, between-appraiser agreement, and agreement against the known reference standard.
In plants lacking formal attribute studies, miss rates often reach twenty percent. False alarm rates frequently exceed ten percent. An inspector visually checking surface finish defects or weld porosity will render entirely different verdicts depending on ambient lighting, shift fatigue, or their individual interpretation of the visual standard. The economic impact of this invisible error is enormous.
During PPAP submissions for automotive components, attribute MSA is a strict IATF 16949 requirement. However, quality engineers routinely undermine the study methodology. They select pristine reference samples that make the visual evaluation trivially easy, ignoring the marginal parts that actually cause production debates. The study becomes a checked box rather than a genuine evaluation of inspection system capability.
A robust attribute study requires selecting ten to thirty marginal samples. You force multiple operators to evaluate these samples repeatedly. If the data reveals high miss rates on defective parts, you must immediately implement improved boundary samples, localized lighting controls, or automated optical inspection. Relying on uncalibrated human judgement remains a massive organizational liability.
Operationalizing MSA in the APQP Cycle
Measurement system analysis cannot exist as an isolated quality function reaction. It must serve as an operational gate within Advanced Product Quality Planning. When engineering selects a gauge for a new production line, they must immediately run a feasibility Gage R&R. Discovering a fifty percent measurement error during the planning phase allows for painless gauge redesign. Discovering it during mass production triggers severe customer delivery delays.
Integrating MSA into Production Lifecycle
- 01APQP Gauge SelectionDefine metrology logic during PFMEA and control plan development.
- 02Pre-Launch Feasibility R&RRun Gage R&R using actual parts and operators before PPAP submission.
- 03PPAP QualificationSubmit statistically valid variable and attribute MSA evidence.
- 04Periodic Re-StudyMonitor gauge wear and operator drift through annual system validation.
Run all initial studies under actual shop floor conditions. Testing a gauge inside a climate-controlled metrology laboratory with a senior quality technician generates falsely optimistic results. You need the data to reflect a Tuesday afternoon on the production line, handled by a newly trained operator. Best-case studies obscure the reality of your manufacturing environment.
Finally, treat measurement systems as dynamic, degrading assets. Gauges experience mechanical wear. Operators develop bad habits over time. Production parts introduce new geometric complexities. An MSA study is not a permanent historical record; it is a periodic health check. Annual re-studies of critical measurement systems remain a non-negotiable requirement for maintaining legitimate IATF 16949 or AS9100 certification.
Validate your measurements rigorously. The engineering time and statistical effort required to run a Gage R&R study is trivial compared to the financial and safety risks of making daily production decisions based on unvalidated noise.