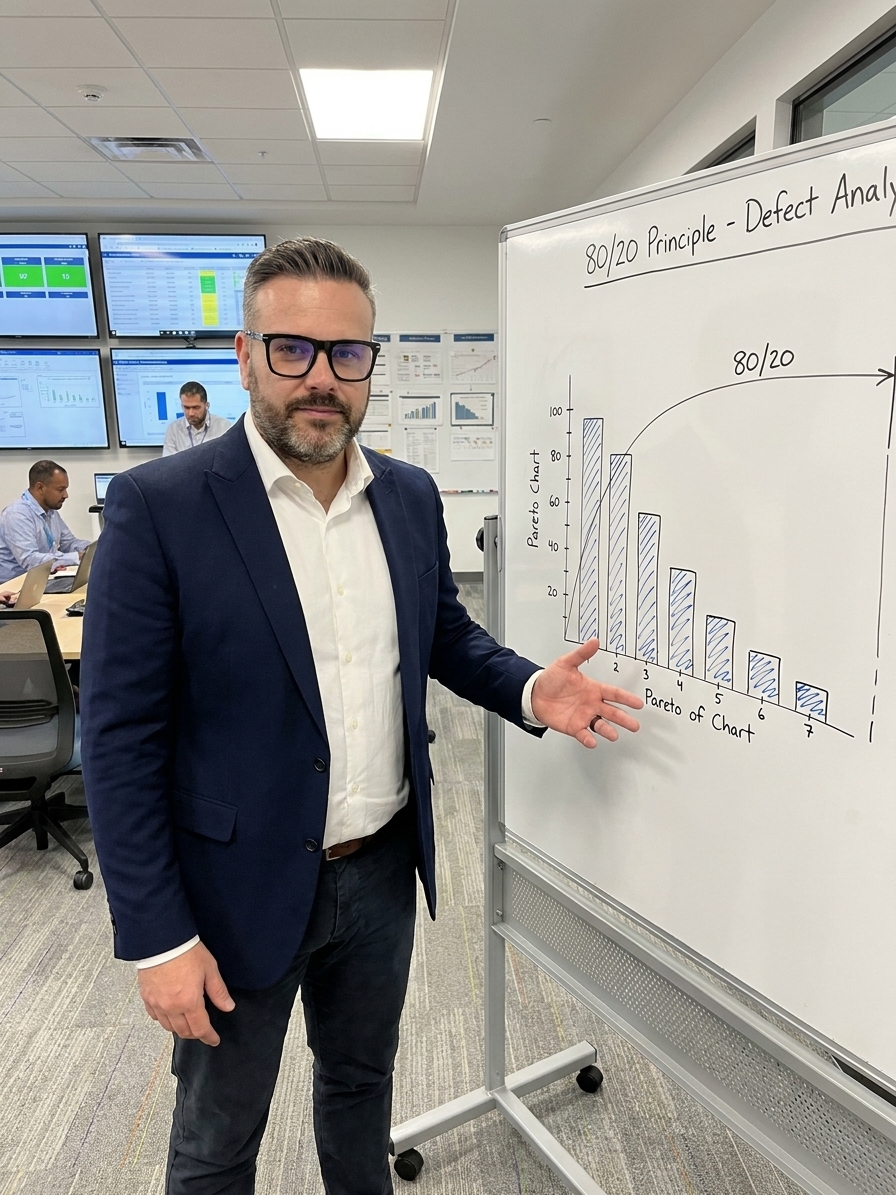
Quality teams routinely confuse exhaustive documentation with strategic action. I have audited plants where engineers catalogue hundreds of defect types on sophisticated spreadsheets, yet completely lack the analytical discipline to prioritise corrective effort. They treat every nonconformance as an equal threat, which paralysesthe organisation into inaction.
This approach exhausts resources without improving overall quality metrics. When a plant manager attempts to fix all documented issues simultaneously, they generate a surplus of low-impact 8D reports and uncompleted CAPA projects. The resulting fatigue guarantees that high-impact systemic failures remain unresolved.
Effective quality engineering requires a deliberate shift from comprehensive problem listing to high-leverage problem solving. The Pareto Principle provides the mathematical and operational framework for this shift, separating the critical causes of failure from the ambient noise of daily manufacturing.
Applying Juran's Vital Few to Manufacturing Quality
Joseph Juran adapted Vilfredo Pareto's observation of unequal wealth distribution into a core tenet of quality management. Juran categorised manufacturing problems into the 'vital few' and the 'trivial many'. He argued that quality departments must concentrate their limited engineering resources almost exclusively on the small percentage of causes generating the majority of defects.
Despite the ubiquity of this concept, I have observed that most organisations fail to implement it with actual discipline. They understand the 80/20 rule theoretically, but their daily resource allocation remains strictly democratic. They distribute engineering hours and capital expenditure evenly across all registered supplier issues, process variations, and customer complaints.
This even distribution guarantees operational mediocrity. In any manufacturing system, whether adhering to IATF 16949 or AS9100, cause and effect are never linearly related. Approximately 80% of scrap costs, warranty claims, and production downtime consistently trace back to roughly 20% of root causes. Failing to isolate these root causes wastes quality budgets on issues that yield negligible returns.

Ranking Defects by Cost of Quality, Not Frequency
Conducting a functional Pareto analysis requires ranking defects by financial impact rather than raw frequency. A low-volume failure on an aerospace assembly line might incur massive regulatory rework costs, whereas a high-volume cosmetic scratch on an automotive stamping might cost only marginal sorting labour. Quality engineers must calculate the total cost of quality for each failure mode.
During a quality system transition at a medical device plant, I challenged a team managing 89 active defect types to rank them by total financial burden. The data revealed that particulate contamination on the filling line represented 41% of their total scrap and rework expenditure. Yet, this specific failure mode had zero dedicated CAPA resources because the team categorised it as a maintenance issue rather than a quality engineering problem.
Functional analysis cuts straight through organisational silos and highlights these operational blind spots. When a single root cause is shown to consume 41% of the quality budget, departmental jurisdiction becomes irrelevant. The data forces management to deploy the necessary cross-functional engineering resources to eliminate the failure immediately.
The 89-Defect Pareto Reality
The Practice of Strategic Neglect in Continuous Improvement
Applying Pareto logic demands a willingness to deliberately ignore certain defects. When a quality team prioritises the vital few, they are explicitly choosing to allocate fewer engineering hours to the bottom 80% of registered problems. Some minor process variations will persist, and some low-impact customer complaints will sit in a backlog. This strategic neglect is a mandatory condition for meaningful improvement.
For a quality director trained to eliminate all nonconformances, this deliberate neglect feels counterintuitive. However, every hour an engineer spends investigating a rare, low-cost defect is an hour stolen from resolving a chronic, high-cost failure. The opportunity cost of undisciplined problem-solving is the single largest source of wasted quality department budget.
Strategic neglect is not the same as permanent acceptance. It is the rigorous sequencing of engineering work based on calculated leverage. Once the vital few defects are eliminated, the Pareto chart shifts, and a new set of high-impact issues rises to the top. The trivial many either get resolved as a byproduct of systemic improvements or naturally age out of relevance.
Exhaustive Problem Solving vs Pareto Discipline
Exhaustive Approach
- Treating all 247 documented defects as equal priorities
- Launching multiple simultaneous CAPA projects with fractional resources
- Wasting engineering hours on low-cost, high-frequency noise
- Reacting to whichever problem generates the most management noise
Pareto Discipline
- Ranking failure modes by total financial impact and scrap cost
- Capping active projects to match available engineering capacity
- Allocating SPC and inspection resources to critical process steps
- Using quantitative data to force cross-functional issue resolution
Extending Pareto Logic Beyond the Production Line
Quality departments severely limit their effectiveness when they restrict Pareto analysis strictly to production defects. The same distribution logic applies to supplier management, process control, and resource allocation. By integrating this analysis into the broader quality management system, organisations can optimise the deployment of their entire quality assurance apparatus.
Consider supplier development and auditing schedules. Instead of auditing every vendor with identical rigour, a Pareto analysis of historical supplier nonconformances will reveal that a small subset of suppliers generates the vast majority of incoming material defects. Risk-based thinking in ISO 9001 demands this approach: focus the highest-tier auditing and monitoring effort on the vital few suppliers that represent the greatest risk to production.
This logic extends directly to process control plans and operator training. Not every step on a PFMEA carries equal weight. 80% of quality escapes typically originate from 20% of manufacturing operations. A Pareto-driven quality system concentrates SPC charting, mistake-proofing, and targeted operator training disproportionately on those specific high-risk operations, rather than blanketing the entire factory in unmanageable inspection requirements.
Institutionalising Pareto Discipline in Management Reviews
To transform the Pareto Principle from a theoretical concept into operational standard practice, management must build it directly into the quality management system's cadence. A Pareto chart of cost of quality should be a standing agenda item during every monthly management review and production meeting. If the data is not refreshed and debated regularly, the organisation will rapidly revert to fighting fires based on subjective urgency.
This institutionalisation requires hard caps on the number of active improvement projects. If a facility has five capable quality engineers, it should not run fifteen concurrent CAPA investigations. Management must limit active projects to what the staff can realistically execute, funding only those initiatives identified by the Pareto analysis as having the highest operational leverage.
A Pareto chart doesn't just prioritise your problems; it exposes the organisational blind spots hiding your biggest costs.
Finally, this discipline must extend beyond the quality department. Training programmes must teach Pareto thinking to line operators, shift supervisors, and manufacturing engineers. When the entire workforce understands the difference between the vital few and the trivial many, the organisational culture fundamentally shifts from reacting to every anomaly to deliberately targeting the constraints that limit overall capability.
Operational Mechanics of Continuous Prioritisation
The Pareto Principle is a dynamic tool, not a static calculation. As a quality team successfully eliminates the top-tier defect causes, the distribution of remaining costs shifts. Today's vital few become tomorrow's trivial many, and previously ignored minor issues rise to the top of the cost chart. The analysis must be repeated on a strict schedule to ensure resources continuously target maximum leverage.
Most organisations fail here. They perform a Pareto analysis once during an ISO 9001 or IATF 16949 surveillance audit preparation phase, generate a visually appealing chart for the auditor, and then abandon the methodology. Six months later, they have reverted to allocating engineering resources based on whoever complains loudest in the morning production meeting.
Sustaining this discipline requires decoupling priority from visibility. A chronic dimensional variation that generates steady, high-cost scrap every week is mathematically more dangerous than a spectacular, highly visible machine breakdown that halts production for a single shift. The Pareto chart anchors the team to the data, ensuring that sustained financial impact dictates priority over momentary operational noise.
The Continuous Pareto Cycle
- 01Quantify Cost of QualityCalculate total financial burden of every defect type, not just raw frequency.
- 02Rank and IdentifyGenerate the Pareto chart to isolate the vital few failure modes driving costs.
- 03Consolidate CAPA ResourcesCap active projects and assign top engineering talent exclusively to the vital few.
- 04Review and RecalibrateRefresh the analysis during management review to catch the newly emerging vital few.