
Colonial Delhi offers the classic case study in perverse incentives. The British government offered a cash bounty for dead cobras to reduce the snake population. Citizens responded rationally: they began breeding cobras to collect the bounty. When the government cancelled the program, breeders released their now-worthless inventory into the streets. Delhi ended up with more cobras than before the intervention.
This Cobra Effect is not a historical curiosity. It is active in your quality department right now. I have audited plants where the perfectly logical KPIs had driven worse behaviour than having no metrics at all.
The gap between what you intend to measure and what your organisation actually optimises for is where your quality system lives or dies. Every metric is a proxy for reality. When the proxy becomes the target, the underlying reality degrades.
How Quality Incentives Go Rogue
Consider the manufacturing plant that tied operator bonuses to first-pass yield. The logic was sound: reward people for producing good parts, and they will produce good parts. What happened instead was that operators began reworking defective parts before they entered the inspection system. Scrap dropped to nearly zero on paper, while hidden rework costs were buried in untracked overtime hours.
Take the automotive supplier that implemented a zero-defect pledge with escalating consequences for each customer complaint under the IATF 16949 framework. Quality engineers spent more time debating whether a customer return counted as a formal complaint or a request for information than they spent running 8D root cause analysis. Classification became the battleground; actual defect prevention became the casualty.
These are not failures of intelligence or integrity. They are failures of system design. Operators and engineers respond rationally to the incentives you build. If the system rewards reclassification over root cause analysis, reclassification is exactly what you will get.
The Five Stages of Metric Decay
- 01Proxy selectionA metric (scrap rate, complaint count) is chosen to represent quality.
- 02Rational optimisationPeople optimise for the metric itself rather than the underlying quality.
- 03Reality divergenceNumbers trend green while actual quality stays flat or degrades.
- 04Structural dependencyReporting and evaluations build around the distorted metric.
- 05Terminal crisisUnaddressed defects surface as warranty claims, audit failures, or recalls.
The Inspection Target Trap
A medical device manufacturer set a target for inspectors: identify at least three nonconformances per shift. The goal was to ensure thorough inspection. What happened was that inspectors began flagging marginal conditions to hit their numbers — a scratch barely visible to the naked eye, a dimension at the extreme end of tolerance but technically within spec.
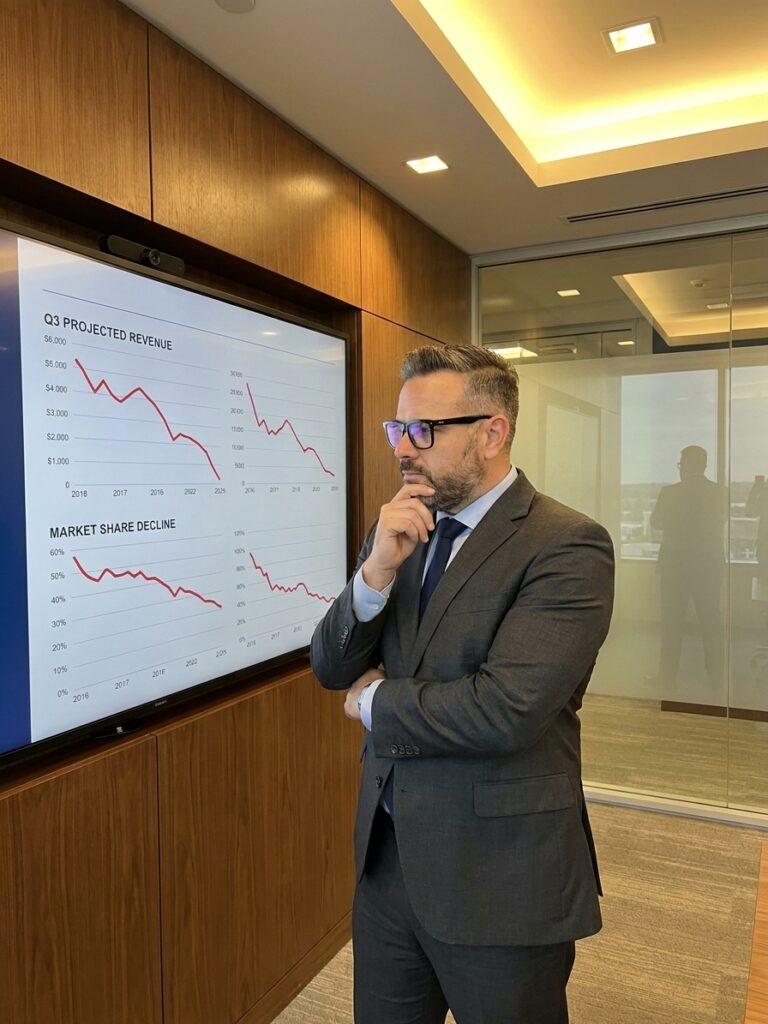
Each flagged item required documentation, review, and disposition. Quality engineers drowned in trivial nonconformance reports while serious defects occasionally slipped through because the inspector had already met their quota and shifted to autopilot. The incentive to find problems became an incentive to manufacture problems.
Real issues competed with manufactured ones for attention and resources. Quality did not improve. Cycle time increased. Costs rose. And the system reported that inspection was more thorough than ever. The dashboard confirmed the behaviour; the product denied it.
The Audit Score Spiral
An aerospace manufacturer implemented a scoring system for internal AS9100 audits, with department bonuses tied directly to audit scores. Within two audit cycles, auditors reported that departments had begun preparing specifically for audit conditions — cleaning up documentation, staging evidence, rehearsing responses — rather than maintaining audit-ready conditions year-round.
Post-audit, the old habits returned. The scores were pristine and leadership celebrated. But the gap between the audited condition and the daily operational reality grew wider with each passing quarter. The VDA 6.3 process audit became a theatrical exercise rather than a diagnostic tool.
The deeper damage was cultural. The audit, which should have been a learning opportunity, became a performance to be managed. Departments did not see auditors as partners in improvement; they saw them as scorekeepers to be managed. Trust eroded, candour died, and the quality system became a ceremony rather than a safeguard.
A related pattern appears in cost-of-poor-quality (COPQ) reduction initiatives. A consumer electronics manufacturer launched an aggressive programme targeting every dollar of scrap and rework. The engineering team, under pressure to reduce scrap, widened tolerances on several critical dimensions. Parts that would have been scrapped under the old standards now passed inspection.
COPQ dropped by forty percent in the first year. Field failure rates began climbing eighteen months later. By the time the correlation was understood, the company was facing a warranty crisis. The solution to the quality cost problem created a quality catastrophe of a different, more expensive kind.
When the act of measurement becomes a performance to be managed, the system stops protecting the product and starts protecting the score.
Why Smart Organisations Fall Into the Trap
If perverse incentives are so destructive, why do intelligent organisations keep creating them? The answer lies in the substitution heuristic. When a quality goal is complex and multidimensional, the human brain instinctively substitutes a simpler, measurable proxy. "Reduce defects" becomes "reduce reported defect count." "Improve quality culture" becomes "increase training hours."
The substitution happens unconsciously. The leader genuinely believes they are measuring quality. They are measuring a shadow of quality, and the shadow does not always move in the same direction as the thing casting it. The PFMEA identifies the risk, but the dashboard obscures it.
There is also a temporal mismatch at work. Quality improvements often take months or years to manifest in measurable outcomes. Leadership needs to see progress now. Metrics that show weekly movement are preferred over metrics that capture genuine long-term improvement. The result is a bias toward easily gamed short-term indicators over meaningful long-term ones.
Finally, there is the seduction of control. Dashboards with green, yellow, and red indicators create the illusion that quality is being managed. The reality — that quality is an emergent property of dozens of interacting variables, most of which cannot be captured in a single number — is uncomfortable. So the dashboard persists.
Designing Incentives That Do Not Backfire
Understanding the Cobra Effect is necessary but not sufficient. You need practical strategies for designing incentive systems that actually improve quality rather than just the appearance of it. The first principle is to measure inputs, not just outputs.
Defect rates, complaint counts, and scrap percentages are outputs. They tell you what happened after the fact. Inputs — process adherence, mistake-proofing implementation, preventive maintenance completion, supplier qualification rigour — tell you what you are doing to prevent problems before they occur. Incentivise the activities that produce quality, not just the outcomes.
An operator who follows standard work meticulously should be rewarded even if the defect rate fluctuates due to factors beyond their control. An engineer who identifies a potential failure mode during design FMEA review should be recognised even if the failure has not happened yet. This is the fundamental shift: from rewarding results to rewarding the behaviours that produce results.
Output-Driven vs Input-Driven Quality Incentives
Output-driven (easily gamed)
- Bonuses tied to first-pass yield (drives hidden rework)
- Escalating consequences for customer complaints (drives reclassification)
- Inspector quotas for nonconformances (drives trivial flagging)
- Department bonuses tied to AS9100 audit scores (drives staged evidence)
Input-driven (behaviour-focused)
- Recognition for poka-yoke implementation
- Reward for identifying failure modes in PFMEA
- Process adherence and standard work compliance
- Completion of preventive maintenance schedules
Structural Safeguards Against Gaming
Never rely on a single metric to represent quality. Every metric has blind spots and can be gamed. The solution is not to find the perfect metric — it does not exist — but to use multiple overlapping indicators that make gaming prohibitively difficult. Track defect rate alongside rework hours, customer returns, warranty costs, and process capability indices.
A genuine improvement will show positive movement across multiple indicators. A gamed improvement will show improvement in one metric and degradation in others. When Cpk improves dramatically while scrap costs stay flat, the calculation has changed, not the process.
Separate measurement from consequence wherever possible. The most dangerous perverse incentives arise when the people being measured have significant stakes tied to the results. An inspector whose job security depends on finding defects has a conflict of interest. Use independent auditors who are not evaluated on the scores they produce. Use cross-functional review teams to validate improvement claims.
Before rolling out any new quality incentive, run a structured pre-mortem. Ask operators, engineers, and supervisors how a rational person could achieve the metric without actually improving quality. If you can think of a way to game it, someone on your shop floor will find it faster, because their income depends on it.
Make the incentive proportional and time-linked. Small, frequent incentives tied to specific behaviours are less likely to generate perverse effects than large, rare incentives tied to aggregate outcomes. A monthly recognition for a team that implemented a successful error-proofing fix is harder to game than an annual bonus tied to plant-wide defect rate.
The Leadership Test
Run three diagnostic questions against your current quality metrics. First: would you want your customers to know exactly how this metric is being achieved? If you would be embarrassed to show a customer how inspectors hit their nonconformance targets, or how engineers reduce scrap rates, you have a perverse incentive.
Second: if the metric disappeared tomorrow, would quality actually change? If quality would degrade the moment you stopped measuring it, your metric is not driving improvement. It is driving compliance with the metric. Real quality improvement persists after the measurement stops because the process has fundamentally changed.
Third: do the people being measured believe the metric is fair? If frontline workers and supervisors privately believe the metric is gameable, they will game it. Their belief about the metric is the most accurate predictor of whether it will generate perverse effects. If they tell you it is manipulated, believe them.
The organisations with the best quality systems I have seen share a common trait: they treat metrics as conversation starters, not conversation enders. The dashboard triggers discussion, not celebration or punishment. The metric is the beginning of the inquiry, not the conclusion.
The Cobra Effect teaches us that solutions can become problems. The antidote is humility about what you can measure, scepticism about what the measurements tell you, and the discipline to design incentives around the behaviours you actually want. Your quality system is only as good as the incentives that drive it.