Walk the floor of a tier-one automotive plant and you will see Statistical Process Control (SPC) charts hanging at the end of the line. They feature meticulously calculated control limits based on standard deviation, complete with Western Electric run rules designed to detect non-random patterns. They look highly professional. The problem is that the operator running the machine rarely understands them.
The operator measures the part, plots the dot, and carries on. If you ask them whether the process is stable or if a special cause of variation is emerging, they will shrug. They are simply a data entry clerk. The actual interpretation of the data happens later, remotely, by a quality engineer who covers three other lines. This separation between measurement and action is a structural defect that costs organisations millions in scrap and rework.
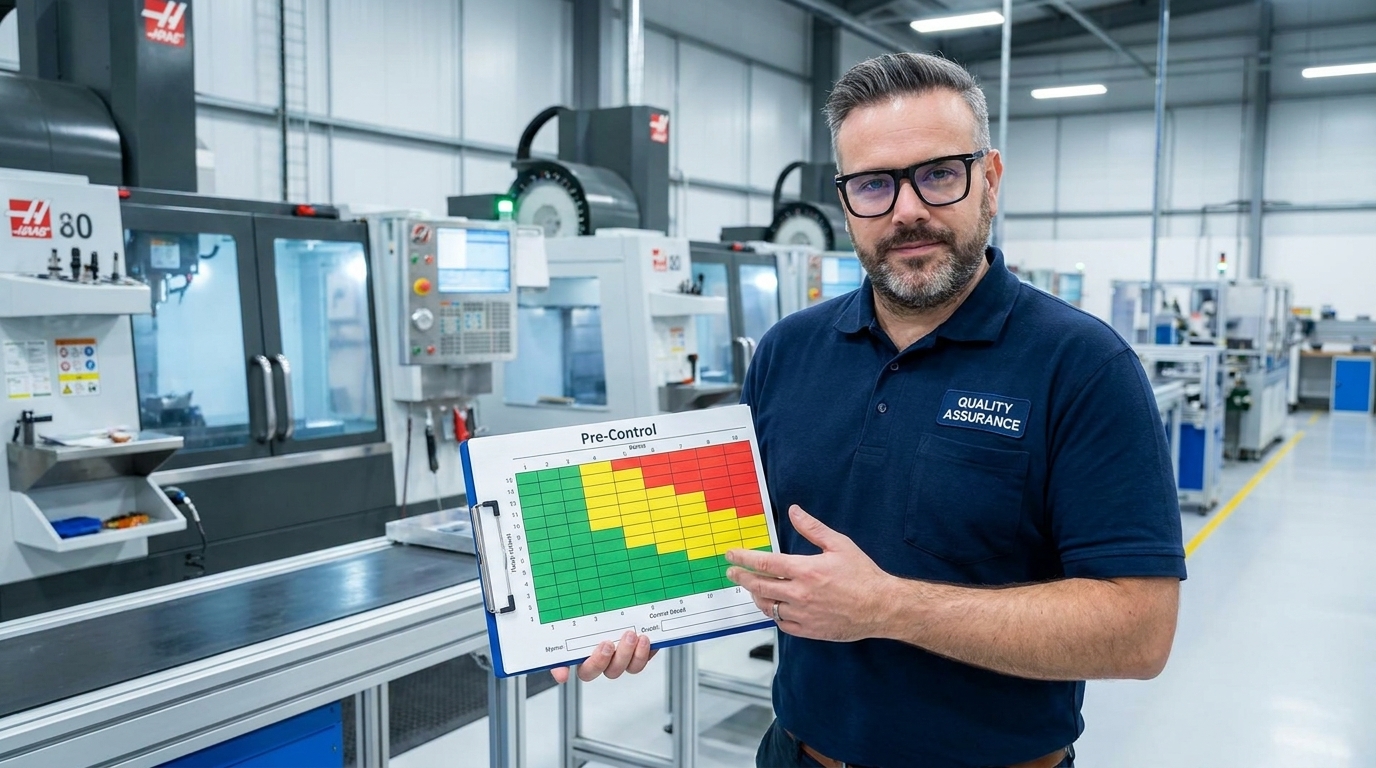
Pre-Control solves this by replacing statistical limits with engineering specifications. Developed in the 1950s by Frank Satterthwaite and Dorian Shainin, the system is provocatively simple. It gives operators a visual, binary mechanism to run or stop the process without waiting for an engineer to decipher a trend.
The Mechanics of Pre-Control Zone Design
Traditional SPC relies on control limits calculated from the process mean and sigma, which require subgroups of data to establish. Pre-Control completely ignores the historical process data. It draws its boundaries exclusively from the specification limits — the nominal dimension and tolerances defined on the engineering drawing or in the PPAP documentation.
The system divides the total engineering tolerance into four equal quarters. The middle two quarters merge to form the green zone. The two outer quarters form the yellow zones. Any measurement falling completely outside the specification limits lands in the red zone. The mathematics are trivial, but the visual impact on the shop floor is immediate.
The decision rules are strictly binary, requiring zero statistical interpretation. The operator measures two consecutive parts and compares them to the zones. There is no need to calculate Cpk, assess skewness, or identify zone-based trends. The logic is hardwired into the colour-coded chart.
I have audited plants where highly capable processes were shut down because an engineer misread a standard SPC run rule. Pre-Control prevents this by keeping the logic transparent. If a process shift occurs, the physical distance the dot moves up the chart corresponds exactly to the dimensional drift.
| Measurement Result | Status | Operator Action |
|---|---|---|
| Both parts in Green zone | Stable | Continue running production. |
| Two Yellows on the same side | Process shift | Stop the machine and adjust the offset. |
| Yellow followed by Red | Borderline scrap | Stop production and call for support. |
| Any part in the Red zone | Out of specification | Immediate stop, isolate parts, escalate. |
Shortening the Feedback Loop on the Shop Floor
Consider a CNC machining line producing precision transmission gears. The internal bore has a specification of 45.000 mm ± 0.050 mm. Under a traditional SPC regime, the operator logs dimensions, but a quality engineer must review the chart for Western Electric rule violations. When the engineer covers multiple lines, the reaction time to a sudden process shift can stretch to twenty minutes or more.

Under Pre-Control, the engineering tolerance immediately dictates the boundaries. The green zone spans 44.975 mm to 45.025 mm. The yellow zones occupy the space up to the specification limits at 44.950 mm and 45.050 mm. If the operator measures 45.028 mm (yellow) and follows it with 45.031 mm (yellow on the same side), the rule is absolute: stop the machine.
The operator adjusts the tool offset, measures two new parts to confirm they are back in the green zone, and restarts the cycle. The reaction time drops from twenty minutes to zero. Defective parts are no longer produced while waiting for an engineer to spot the trend.
The Statistical Validity of Simple Rules
Simplicity does not mean Pre-Control lacks statistical rigour. The rules are built on the probabilities of the normal distribution. If a process is capable — meaning Cpk is at least 1.0 — the natural spread of the data fits comfortably within the specification limits, and the process mean sits close to the engineering nominal.
Because of this distribution, the probability of a single measurement landing in the yellow zone is approximately 7%. The probability of two consecutive measurements landing in the same yellow zone is less than 0.5%. Therefore, if an operator sees two yellows in a row, it is a statistically valid signal that a special cause has shifted the process mean.
Pre-Control Statistical Probability
The false alarm rate for Pre-Control hovers around 2%, which is slightly higher than a standard 3-sigma control chart but completely acceptable for shop-floor execution. Dorian Shainin argued that it is better to quickly detect 90% of process shifts and fix them immediately than to wait for perfect detection that arrives after the machine has already produced scrap.
The system compensates for slightly lower detection sensitivity by enforcing a significantly higher measurement frequency. When operators measure continuously and react instantly, the brief delay in identifying a subtle drift is heavily outweighed by the speed of physical correction at the machine.
Deploying Pre-Control Alongside Traditional SPC
Pre-Control is a targeted tool, not a universal replacement for SPC. Smart organisations build a portfolio of quality tools and apply them based on the specific manufacturing context. Attempting to replace all SPC with Pre-Control is a fundamental misuse of the methodology and will inevitably fail regulatory or customer audits.
Pre-Control excels in environments with high operator turnover where deep SPC training is impractical. It is highly effective for short production runs where you cannot afford to wait for 25 subgroups to establish traditional control limits. It provides immediate feedback during changeovers, tool setups, and first-article inspections, telling the setter instantly if the process is centred.
Better to quickly detect 90% of shifts and fix them immediately than wait for perfect detection that arrives after producing scrap.Dorian Shainin
Conversely, traditional SPC remains necessary for critical safety characteristics mandated by IATF 16949 or AS9100. Long, stable production runs benefit from the deep analysis of Cpk, trends, and correlations that SPC provides. Complex processes requiring Design of Experiments (DOE) to understand multivariate interactions still demand rigorous statistical software, not coloured charts.
Use Pre-Control for secondary dimensions and high-mix characteristics. Reserve full SPC for the critical-to-quality (CTQ) features where your customer or regulatory body explicitly mandates it. This dual approach optimises your engineering resources and empowers the operator simultaneously.
Implementation Pitfalls and Operational Discipline
Successful implementation requires strict adherence to the binary rules. The most common failure mode occurs when team leaders or engineers try to complicate the system. If a supervisor adds caveats like 'if you get two yellows on opposite sides, just keep running,' they destroy the clarity that makes Pre-Control effective. The rules must remain absolute and strictly enforced.
Visualization is non-negotiable. A Pre-Control chart without bright, distinct colour zones is useless. The physical or digital display must sit directly at the workstation. The operator must instantly see the boundary between the green and yellow zones without doing mental arithmetic. If they have to calculate where the zone ends, the system will fail within a week.
Management must actively support operator autonomy. If a machine operator stops the line following a Pre-Control rule and receives criticism for hurting OEE or line utilization, the system is dead. Leadership must reinforce the behaviour, recognising that stopping the machine to adjust a drifting tool prevents hours of rework and scrap downstream.
Digital transformation actually amplifies the power of Pre-Control. Modern manufacturing execution systems (MES) and IoT-connected gauges can automate the process entirely. A smart gauge feeds the dimension to a screen, the software displays the corresponding colour zone, and if it registers a violation, the PLC automatically halts the machine and locks the part for quarantine.
Industry 4.0 technology does not replace the underlying logic of Pre-Control; it removes the human bottleneck of data entry. The cloud dashboard updates in real-time, giving quality managers immediate visibility into which lines are running green and which operators are actively managing process drifts on the floor.
Pre-Control is the missing link between quality engineering and operator execution. It provides a reliable, mathematically sound method for pushing process control directly to the source of production. When applied correctly to the appropriate characteristics, it eliminates the gap between dimensional data and corrective action.