
The PPAP package includes a beautiful bell curve sitting perfectly between two specification limits, with a Cpk of 1.33 printed underneath in bold green font. The supplier presents it, the quality team nods approvingly, and the customer signs off. Then production starts, and the scrap rate hits six percent.
Process capability analysis was designed to provide statistical proof that a manufacturing process consistently meets requirements. Instead, it has become one of the most misused tools in quality engineering. The calculations themselves are straightforward. The assumptions behind those calculations get violated so routinely that the numbers on the report bear almost no resemblance to what is actually happening on the shop floor.
Capability indices are not comfort blankets. They are diagnostic instruments. When teams treat them as compliance checkboxes rather than process indicators, they hide variation and guarantee field failures. Fixing this requires auditing the statistical validity of the data before trusting the math.
The Three Assumptions That Invalidate the Math
The fundamental requirement for capability analysis is that the process must be in a state of statistical control. This means stable, predictable, and influenced only by common cause variation. In reality, an engineer collects thirty consecutive parts, runs them through a CMM, pastes the data into a spreadsheet template, and reports the Cpk. Nobody checked whether the process was stable first. Nobody verified that the samples represented normal operating conditions rather than a golden setup run specifically prepared for the study.
If the process is not stable, capability indices are meaningless. You are computing statistics on a moving target. A drifting or shifting process renders the standard deviation calculation invalid, meaning the reported Cpk predicts nothing about the next production run. The index simply captures a brief snapshot of history, not a reliable forecast of future performance.
The second assumption is normality. Many manufacturing processes are naturally non-normal. A machining operation with a hard tooling stop produces one-sided distributions. Geometric tolerances like position, concentricity, and runout are inherently non-normal because they are calculated as absolute values. Applying standard normal-based formulas to heavily skewed data yields numbers that look reassuring but are mathematically invalid. A Cpk of 1.33 computed on skewed data might correspond to a true capability of 0.8, meaning the actual defect rate is ten times higher than the index suggests.
The third assumption is representative sampling. A setup technician who knows a capability study is happening will spend extra time dialling in the machine, use a fresh tool, and let the process warm up longer than usual. The resulting thirty parts come off the line in a condition that will never be replicated in actual production. This is not fraud; it is human nature under deadline pressure. But it makes the resulting Cpk fiction.
Sample Size and the Illusion of Precision
A supplier submits a Cpk of 2.0 on a critical dimension. The number looks impressive until you ask how many parts were measured. With only twelve samples, the confidence interval around that Cpk is enormous. The true process capability could be anywhere from 1.2 to 3.5. The supplier is not lying about the calculation. They simply collected so little data that the number tells you almost nothing about production reality.
You need at least 100 individual measurements — ideally 125 or more — before a capability index has enough statistical power to be trusted for production decisions. With 30 samples, a Cpk estimate carries a margin of error of roughly plus or minus 0.3 at 95 percent confidence. That is the difference between a process rated excellent and one rated marginal. Reporting the point estimate without its confidence interval hides this uncertainty from the decision-maker.
In low-volume aerospace environments, requiring 100+ samples is often impossible. Engineers run the standard formula on 20 parts and submit it to the customer. Legitimate statistical methods exist for short-run capability — standardised ranges, pooling data across similar part numbers, or Bayesian approaches incorporating prior knowledge. Most organisations ignore these methods. They run the standard formula on too few parts and hope nobody asks questions.
Multi-Stream Processes and Averaged Variation
An automotive supplier running an injection moulding machine with four cavities submits a combined Cpk of 1.33. The number passes the threshold. But a cavity-to-cavity analysis reveals that cavity three is consistently running at a Cpk of 0.7, while the other three cavities exceed 1.6. The overall number masks a serious problem because the good cavities dilute the bad one. This is the multi-stream problem, and it is pervasive.
Any process with multiple machines, fixtures, cavities, operators, or shifts has multiple process streams. Combining them into a single capability calculation averages away the variation you most need to see. The standard deviation of the pooled data set looks acceptable, but the pooled mean is a mathematical artefact, not a physical reality. The worst stream dictates the scrap rate, but the combined index hides it completely.
If your process has multiple sources of variation, you must analyse each stream independently. Report the worst stream, not the average. If the worst stream is not capable, the overall process is not capable. Averaging good and bad streams is how nonconforming parts get shipped to the customer. This principle applies equally to multi-spindle machining, multi-cavity moulding, and multi-shift production.
Drift, Exclusion, and the FDA Warning Letter
A medical device company ran capability studies quarterly. One quarter, the Cpk dropped from 1.4 to 0.9. The quality manager panicked until an engineer discovered the data set included a two-day period where a worn fixture caused a mean shift. Once those two days were removed, the Cpk jumped back to 1.4. The manager excluded the data. The report showed 1.4. Six months later, the FDA found the same fixture issue during an inspection and issued a warning letter.
Excluding unfavourable data from a capability study does not improve your process. It hides a problem that will surface later, usually at a much higher cost. When the customer or regulator finds the issue you suppressed, the loss of credibility far exceeds the cost of investigating the root cause. A capability report that survives only because the unfavourable data was deleted is a liability, not an asset.
The most dangerous capability report is not the one showing a low Cpk. It is the one showing a high Cpk computed on invalid data.
A semiconductor fab monitored Cpk on wafer thickness. The index was consistently above 1.67. But the mean was drifting upward by 0.2 microns per month. Each monthly study showed acceptable capability because the process remained within specification. Nobody noticed the trend until the mean shifted past the upper control limit and yield crashed. Cpk is a snapshot. It tells you nothing about long-term stability. A process can be capable today and incapable in three months if tooling wears or environmental conditions shift.
Executing a Defensible Capability Study
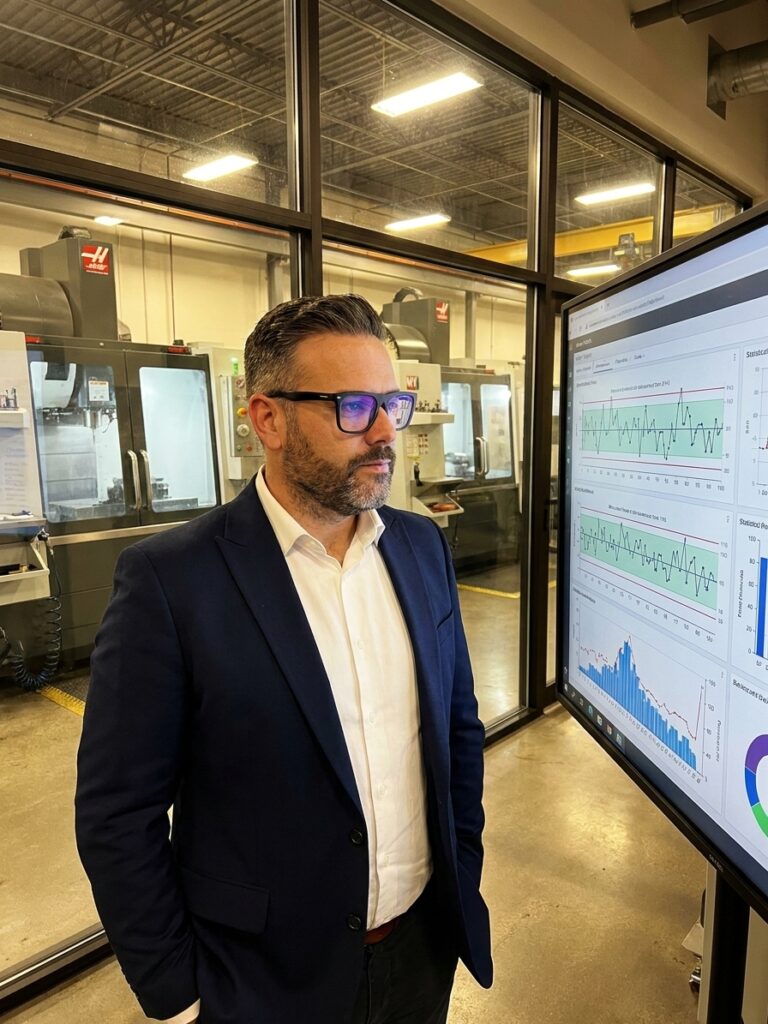
Doing process capability right requires discipline, not advanced mathematics. Before computing any index, plot the data on a control chart — Individuals and Moving Range for one-at-a-time data, or X-bar and R for subgrouped data. Look for points beyond three sigma, runs of seven or more on one side of the centreline, trends, and oscillations. If the chart shows instability, stop. Fix the process first. Capability indices on an unstable process are actively misleading.
Run a normality test. Anderson-Darling is preferable because it is sensitive to deviations in the tails, which is where defects occur. If the p-value is below 0.05, investigate whether the non-normality stems from a fixable process issue like measurement system variation or mixed process streams. If the non-normality is inherent to the process physics, fit an appropriate distribution — Weibull, lognormal, largest extreme value — and calculate capability based on percentiles rather than standard deviations.
Collect at least 100 individual measurements over a representative period — not a single setup run, not one shift, not the first hour after maintenance. The data must capture normal variation in material, operator, tooling wear, and environment. Report confidence intervals on every index. A Cpk of 1.3 plus or minus 0.4 is a very different story from a Cpk of 1.3 plus or minus 0.05. Also report the expected PPM alongside the index, because 63 defective parts per million is more actionable to non-technical stakeholders than a Cpk of 1.33.
Valid Capability Study Sequence
- 011. Verify StabilityPlot data on a control chart. No stability, no capability index.
- 022. Test NormalityUse Anderson-Darling. If p < 0.05, investigate process or fit non-normal distribution.
- 033. Separate StreamsAnalyse each machine, cavity, or shift independently. Report the worst stream.
- 044. Collect Sufficient DataMinimum 100 measurements across a representative production period.
- 055. Report HonestlyInclude confidence intervals and expected PPM alongside the point estimate.
Correcting Misconceptions and Aligning Specifications
A high Cpk does not mean the process is good. It means the process is producing within specifications. If those specifications are wrong — set too wide based on outdated requirements, or inherited from previous drawings without functional analysis — a high Cpk gives false confidence. Processes with Cpk above 2.0 have caused field failures because the spec limits did not reflect actual functional requirements. Overly tight specs waste money; overly wide specs ship defects.
Cp and Cpk are not interchangeable. Cp assumes the process is perfectly centred. Cpk accounts for actual centring. A process with Cp of 2.0 and Cpk of 0.8 is producing within spec only because the tolerance is wide. The mean is so far off-centre that any slight shift will push parts out of specification. This is a process living on borrowed time, yet the reported numbers look acceptable on paper.
Capability erodes. Tooling wears, materials change, operators rotate, and machines drift. A capability study is valid for the period it represents, not forever. Processes must be re-evaluated periodically, and the frequency should depend on how much the process is capable of changing. Track Cpk as a time series. Watch for downward trends and investigate drops before they become failures.
Compliance Reporting vs Diagnostic Capability
What teams do
- Run study once for PPAP submission
- Pool all streams into one Cpk
- Report point estimate without confidence interval
- Exclude data from bad days to pass threshold
What works
- Verify stability and normality before calculating
- Report worst stream, not the blended average
- Include confidence intervals and expected PPM
- Track Cpk as a time series to detect drift
Audit and Action Priorities
If you are responsible for process capability, audit your existing studies. Pick ten recent reports at random. For each one, check whether the process was verified as stable, whether normality was tested, whether enough samples were used, whether process streams were separated, and whether confidence intervals were reported. If any answer is no, the study needs to be redone or flagged as unreliable.
Train your team on assumptions, not just calculations. Most engineers know how to compute Cpk. Far fewer know the conditions under which that computation is valid. A focused workshop on capability assumptions will prevent more quality problems than a new statistical software package. The math is not the hard part. The discipline is.
Make stability a prerequisite for reporting. No control chart, no capability index. This single rule eliminates the majority of misleading capability reports. Align specifications with function by working with design engineering to ensure tolerance limits reflect true assembly interactions. And every time you sign off on a capability report, remember that you are making a promise to your customer. Make sure the number on the page actually supports that promise — with assumptions verified, limitations acknowledged, and confidence intervals honest.