
Walk into any supplier quality review and you will hear the same question: what is your Cpk? The number arrives, usually between 1.33 and 1.67, and everyone nods. The metric has become a proxy for confidence that a manufacturing process can consistently meet specification. But a Cpk value without rigorous context is not confidence. It is a headline without the article.
Across two decades in automotive and aerospace, I have seen plants cut defect-related costs by 70% while sustaining 98% customer satisfaction. That performance did not come from hitting capability targets on a spreadsheet. It came from building a quality system that understood the physical reality behind the math. When the underlying assumptions of a capability index are wrong, the number does not just lose value, it actively misleads engineering and management.
Organisations routinely misuse capability indices in supplier approvals and internal PPAP audits. They treat a summary statistic as proof of stability. A credible capability study requires verifying the measurement system, confirming statistical control, and understanding distribution. Anything less is administrative theatre that hides variation until it surfaces as a costly field failure.
What Cpk Actually Measures
Cpk quantifies the relationship between process spread (within three standard deviations of the mean) and specification limits, adjusted for how centred the process is. A Cpk of 1.33 means the nearest specification limit sits four standard deviations away from the process mean. That is the entirety of the arithmetic. It is a snapshot of a specific moment, under specific conditions.
What this index does not tell you is whether the process is fundamentally stable over time. A snapshot cannot prove stability. It cannot tell you whether the data follows a normal distribution, which the formula assumes. It also cannot confirm whether your measurement system can actually detect the variation you are reporting, or whether your subgroups represent long-term behaviour.
A single number compresses all these assumptions into one figure. When engineers calculate Cpk from a month of production data without checking an SPC chart first, they violate the foundational requirement of capability analysis. The formula produces output regardless of whether the math is valid. The result is a metric that looks impressive but masks underlying instability.
The Five Failures of Capability Analysis
The most common error is calculating Cpk on an unstable process. Capability indices assume statistical control. If special-cause variation is present, shifts or outliers will inflate the standard deviation, making the resulting Cpk entirely meaningless. Always precede capability analysis with an Xbar-R or I-MR control chart, and only proceed once the process demonstrates control over 25 or more subgroups.
The second failure is ignoring the difference between short-term and long-term indices. Cp and Cpk use within-subgroup variation, while Pp and Ppk use overall variation. When a process is perfectly stable, these numbers converge. When it is not, they diverge dramatically. A supplier might report a Cpk of 1.67 while hiding a Ppk of 1.12, concealing process drifts that the customer will ultimately experience.
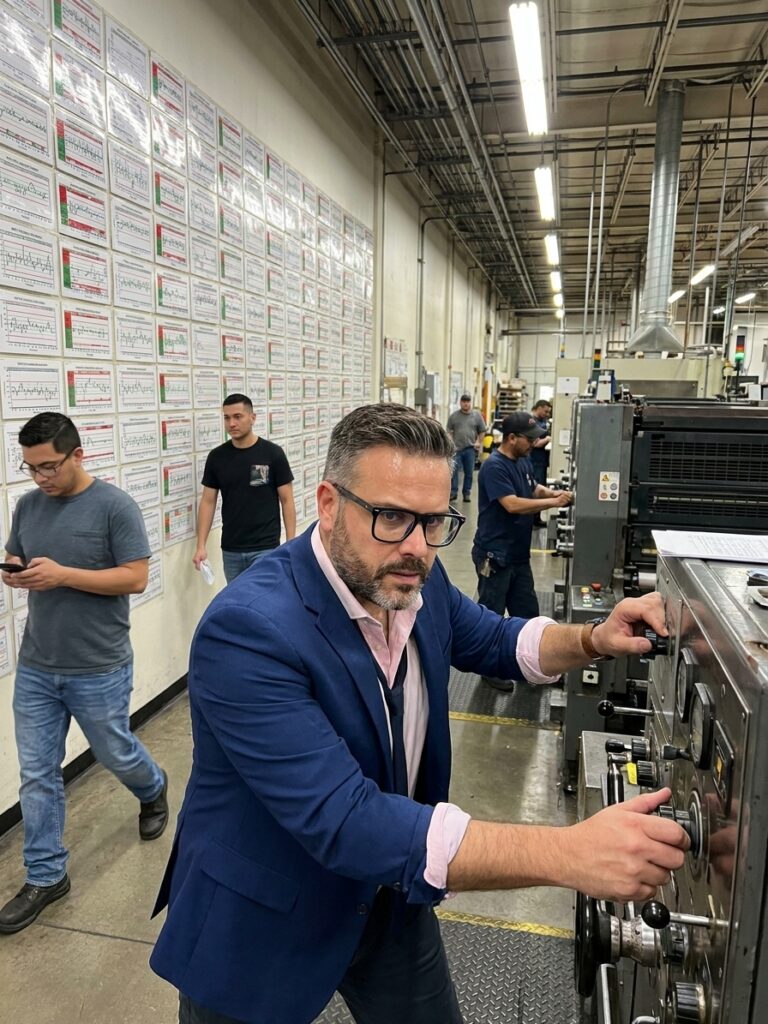
Third, engineers routinely pool data across different operating conditions. A CNC machine running three shifts with varied operators and material lots is not a single homogeneous process. Dumping all measurements into one dataset calculates a Cpk that represents no single operating reality. Segment capability studies by known sources of variation. If the numbers differ significantly, you have identified a factor worth controlling.
Fourth is trusting the measurement system blindly. If a gauge contributes heavily to total observed variation, your capability index reflects the measurement device as much as the manufacturing process. A gauge R&R study is an ongoing prerequisite, not a one-time qualification activity. Re-qualify measurement systems whenever the process, product, or gauge changes.
Finally, assuming normality without testing guarantees false results. Many geometric tolerances like flatness and surface finish are inherently non-normal. Applying a normal-based Cpk to skewed data produces systematically wrong estimates of defect rates. Test normality using Anderson-Darling, apply a Box-Cox transformation if required, and report the method alongside the number.
Measurement System Acceptance Thresholds
Short-Term Versus Long-Term Reality
Understanding the gap between Cpk and Ppk is essential for diagnosing process health. Cpk uses within-subgroup variation, representing potential capability if the process were perfectly centred and stable. Ppk uses overall variation, capturing actual performance including all sources of drift and shift. The mathematical difference between them reveals how much your process shifts over time.
When a process experiences tool wear, material transitions, or thermal expansion, the overall variation increases while the short-term subgroup variation remains small. A supplier can report a strong Cpk of 1.67 while delivering a Ppk of 1.12. The gap tells you the process is unstable. The short-term calculation hides the exact variation your customer receives in their incoming inspection.
| Index | Variation Source | What It Reflects |
|---|---|---|
| Cp / Cpk | Within-subgroup | Potential capability if process is perfectly centred and stable |
| Pp / Ppk | Overall variation | Actual performance including all long-term sources of drift |
| Gap Analysis | Cpk minus Ppk | If greater than 0.3, investigate sources of instability immediately |
Engineers must report both indices simultaneously. If Cpk exceeds Ppk by more than 0.3, investigate the sources of instability before trusting either number. This diagnostic approach shifts the conversation from accepting a headline metric to understanding process dynamics. Looking only at Cpk means seeing the best-case scenario, a version of reality that mass production will never sustain.
Breaking the Supplier Capability Trap
Supplier quality functions routinely require Cpk greater than 1.33 as a condition of approval, particularly during PPAP submissions in IATF 16949 environments. This creates a perverse incentive. Suppliers learn exactly what number satisfies the customer and engineer their submissions accordingly. The goal becomes passing the document check, not validating the manufacturing process.
Common tactics include cherry-picking the best production run for the study and excluding setup parts from the dataset even when they represent normal production. Suppliers might calculate Cpk on an easy-to-hold dimension while leaving the critical-to-quality feature unreported. The customer receives a document with an impressive number, the supplier keeps the contract, and nobody asks whether the number reflects reality.
A Cpk value without supporting evidence is not a measure of capability, it is a story someone chose to tell.
Breaking this cycle demands a different approach to supplier evaluation. Instead of accepting a single index on a PPAP, require both Cpk and Ppk accompanied by the raw data set used for calculation. Ask for the SPC control chart that precedes the capability study. No chart means no credibility. Specify the data collection plan including subgroup size, frequency, and duration.
Finally, monitor incoming quality against the claimed capability. If a supplier's Cpk is genuinely 1.67, you should see virtually zero nonconforming parts at incoming inspection. When incoming data contradicts the capability claim, that discrepancy becomes the basis for a productive diagnostic conversation. Move away from punitive audits and toward collaborative root cause analysis.
Structuring a Credible Internal Study
Organisations that use capability indices effectively share common traits. Their studies follow a structured sequence rather than applying a formula to whatever data is available. The first step is defining the process boundaries. Document the specific operation being studied, including machine, tooling, parameters, material specification, and operator qualification level. Anything not held constant becomes a source of variation.
Next, verify the measurement system on the actual feature using the actual operators and the actual gauge. If acceptance criteria are not met, fix the measurement system before proceeding. Capability numbers generated from an unqualified gauge are administrative fiction. Once the gauge is proven, establish stability by collecting at minimum 25 subgroups of 4-5 parts each, covering normal production variation.
Valid Capability Study Sequence
- 01Define BoundariesDocument machine, tooling, parameters, material, and operator level to isolate variables.
- 02Verify MeasurementExecute gauge R&R on the actual feature. Fix the gauge if variation exceeds ten percent.
- 03Establish StabilityCollect 25 subgroups, plot control charts, and eliminate all special causes before proceeding.
- 04Test DistributionRun Anderson-Darling normality test. Apply Box-Cox transformation if data is skewed.
- 05Calculate and ReportReport both Cpk and Ppk with control charts, normality results, and gauge status.
Plot the control charts and aggressively identify special causes. Eliminate them. Only when the chart shows undeniable statistical control should capability calculation begin. Test distributional assumptions and document the choice. Calculate both short-term and long-term indices, reporting them together with sample size, normality test results, and gauge R&R acceptance status. Transparency accelerates decision-making by preventing reliance on unvalidated numbers.
Maintaining Capability Over Time
Capability is not a permanent property. It degrades as tooling wears, drifts as equipment ages, shifts when material suppliers change, and breaks when new operators take over. Treat capability studies as periodic validation rather than a one-time qualification hurdle. The mathematical assumptions that held true during a PPAP will not survive a year of unmonitored mass production.
Trigger recalculation whenever tooling or fixtures are replaced or refurbished. Recalculate when material specifications change, or when equipment undergoes major maintenance or relocation. Process modifications like changes to speeds, feeds, temperatures, or pressures invalidate the previous baseline. Most importantly, trigger recalculation the moment SPC charts show new special-cause patterns emerging on the floor.
The cultural problem around Cpk is behavioural, not mathematical. A single number feels like certainty. It allows meetings to move quickly, contracts to be signed, and problems to be deferred. Organisations that rely on indices they have never validated are making commitments based on assumptions they have never tested. The goal is not to abandon Cpk, but to refuse accepting it without rigorous evidence.
Every Cpk value should carry its supporting documentation the way a structural engineer's calculation carries its assumptions. Establish a strict annual review cycle at minimum. Embedding this discipline into the quality management system ensures the organisation reacts to physical reality, not statistical illusions. This is the exact mechanism that allows leading automotive and aerospace manufacturers to sustain exceptional quality over decades.