
Most manufacturing plants treat quality data as a rearview mirror. Managers stare at yesterday's scrap rates and hope tomorrow looks different. This reactive stance guarantees you are always one step behind the defect. Control charts tell you when a process has already changed, but by the time a point breaches the upper control limit, the non-conforming parts are already in the bin.
Quality forecasting closes this gap. It takes your existing SPC measurements, sensor readings, and inspection results, and projects them forward. This is not a guess. It is a statistically grounded prediction that tells you what your defect rate will look like in 72 hours if no corrective action is taken. The shift from monitoring to forecasting is the difference between fire prevention and firefighting.
Building this capability does not require machine learning or massive capital investment. It requires clean data, basic statistical methods, and the operational discipline to act on probabilities. Over my career, implementing ISO 9001 and IATF 16949 systems across automotive and aerospace plants, I have seen straightforward time-series models outperform complex algorithms simply because the quality team understood and trusted the math.
What Quality Forecasting Actually Is
Quality forecasting is the discipline of understanding your process behaviour well enough to project it forward. When a meteorologist forecasts rain, they provide a probabilistic outcome based on historical patterns and current conditions. Quality forecasting works the same way. You state that based on current trajectory, there is an 82% probability your defect rate will exceed 1.2% within the next three days.
Teams often confuse forecasting with standard trending reports. Trends describe the past. Forecasts quantify the future. If your Cpk is drifting downward, a trend chart simply shows the decline. A forecast calculates the exact shift when Cpk will drop below 1.33, giving you a concrete timeframe for intervention.
This discipline does not replace process understanding. If you do not know your process mechanics, your forecast is statistical noise with confidence intervals. You must understand how tool wear, material variance, and cycle times interact before applying mathematical models. The forecast provides the timing; the engineering knowledge provides the solution.
The Statistical Toolkit
Quality forecasting operates across a spectrum of complexity. Start simple. The best forecast model is the one your production team actually understands and trusts. Moving averages and exponential smoothing are highly effective for processes that change slowly, such as tool wear or material lot variations.
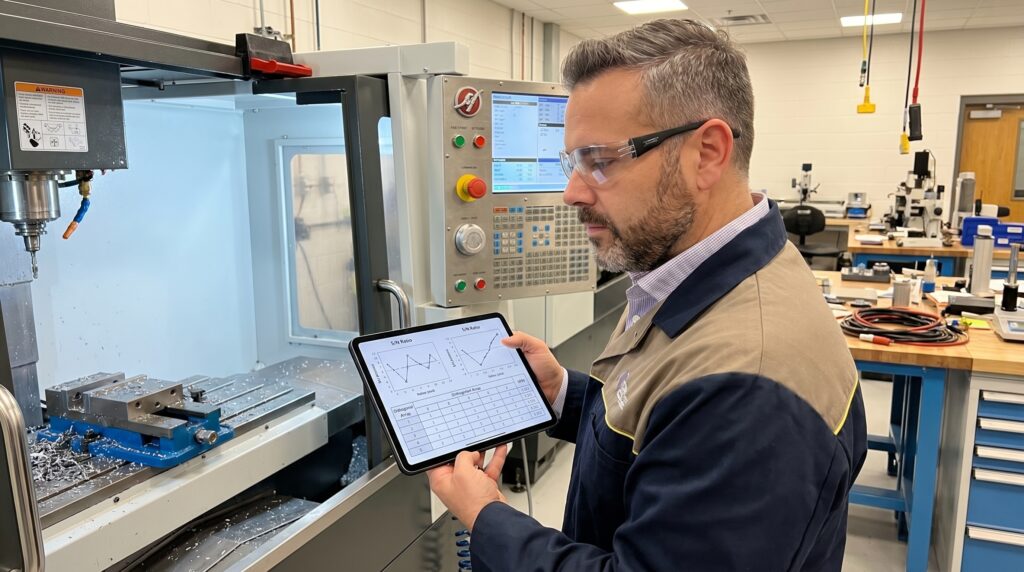
When single-variable trends are not enough, deploy time-series decomposition. This method isolates seasonality, cyclical patterns, and random noise from the underlying trend. I have audited plants where scrap rates spiked predictably every third week. Decomposition revealed a 21-day cycle perfectly matching their tool change schedule. The forecast predicted the spike and exposed the root cause.
For metrics showing serial correlation, ARIMA models are the workhorse. If today's dimensional measurement depends on yesterday's, ARIMA captures that relationship. Multivariate forecasting goes further by incorporating leading indicators. If oven temperature drift precedes dimensional non-conformance by twelve hours, modelling that relationship lets you forecast defects based on current process conditions, not just historical quality data.
Reactive Monitoring vs Predictive Forecasting
What teams do
- React to control chart limit breaches
- Investigate after scrap is generated
- Rely on trending reports of past Cpk
- Replace tools on fixed schedules
What works
- Calculate probability of breaching limits
- Implement containment before the defect
- Project Cpk trajectory forward mathematically
- Forecast tool failure using spindle load data
Building the Forecasting System
Implementation requires rigorous data management. Garbage in, garbage out applies with extreme force to forecasting. Spend 70% of your setup time cleaning data and verifying measurement systems. If your gage R&R is poor, you are forecasting measurement noise, not process variation. Unrecorded events, like undocumented tool changes, create mystery shifts that invalidate your models.
Model selection demands strict validation. Train your model on the first 80% of your dataset and forecast the last 20%. Track accuracy using Mean Absolute Percentage Error (MAPE). A forecast that is right 50% of the time within its 95% prediction interval is a coin flip, not a predictive tool. If the residuals show patterns, move up a level in model complexity.
The forecast must drive operational action. A prediction that lives in a spreadsheet is useless. Build visual dashboards showing the forecast line, action thresholds, and the remaining time until a limit is breached. Standardize your response: green means monitor, yellow means investigate, red means activate containment protocols.
Deploying a 30-Day Pilot
You do not need a capital project to begin. A focused 30-day pilot proves the value of forecasting without disrupting existing systems. Pick one critical quality metric, preferably one tied to a Tier-1 customer complaint or high scrap cost. Gather twelve months of daily data and plot it manually before applying statistical software.
The 30-Day Quality Forecasting Pilot
- 01Week 1: Data preparationSelect one critical metric, gather 12 months of data, verify gage R&R, and plot visually.
- 02Week 2: Model fittingFit exponential smoothing and linear trend models. Compare outputs against last month's actuals.
- 03Week 3: Dashboard buildVisualize the two-week forecast with prediction intervals. Review with production supervisors.
- 04Week 4: Parallel trackingRun the forecast alongside existing SPC. Evaluate accuracy and refine decision thresholds.
During week two, fit three simple models: exponential smoothing, moving average, and linear trend extrapolation. Compare their forecasts against the most recent month of actual data. Pick the winner based on lowest error. Do not introduce machine learning at this stage. Keep the mathematics transparent so the engineering team trusts the output.
Run the forecast in parallel during week four. Do not make production decisions based on it yet. Track whether the model accurately predicted the quality outcomes. If the forecast missed the mark, investigate the data inputs. Usually, you will find missing process event logs or poor measurement system resolution causing the deviation.
Overcoming Organizational Resistance
The mathematics of forecasting are straightforward. The organizational change is hard. Quality teams accustomed to reacting to defects often resist predictive methods. Forecasts speak in probabilities and confidence intervals. Production managers want absolute certainty. When you say there is a 90% chance of defects, some managers hear that you do not really know the outcome.
Building trust requires transparency and a track record of useful predictions. Every forecast will occasionally be wrong. The question is not whether you will miss, but whether you miss less often than you would without forecasting. Leadership must understand probabilistic thinking and avoid punishing honest statistical estimates that do not perfectly align with reality.
A forecast without a decision framework is just an expensive chart.
Data silos present the largest technical hurdle. The best forecasts combine quality measurements, process parameters, and maintenance logs. In most plants, these datasets live in three different systems controlled by three different departments. Breaking down these silos requires executive mandate. The IT integration is trivial compared to the political effort needed to align departmental priorities.
Operational Impact and Next Steps
Consider a precision machining operation replacing cutting tools on a fixed schedule. Tools sometimes lasted 12,000 parts, sometimes failed at 6,000. By building a forecast model based on spindle load trends and historical tool life data, the plant predicted tool failure within a 500-part window. This reduced tool costs by 23% and cut tool-related defects by 89%.
Forecasting also secures the supply chain. An electronics manufacturer facing incoming material variance used supplier performance trends to forecast incoming quality. When the forecast signalled trouble, they increased inspection intensity proactively. Supplier-related line stoppages dropped by 44%. The same principle applies to internal processes: anticipate the variance before it stops your line.
As manufacturing plants become more sensor-dense, quality forecasting will become a core operational capability. Clean data will always beat fancy algorithms. Simple models will always beat black boxes when people need to trust the answer. Start with one metric, build the 30-day pilot, and let the results drive the expansion.