A plant director called me on a Sunday evening. His voice was tired. Every Monday, his management team sat through a review packed with red KPIs. Every week, they promised improvement. The numbers never moved.
He had enough data. He had a competent team. What he lacked was an operating system to convert that data into decisions, decisions into actions, and actions into sustained results. He needed a Quality Operating System (QOS).
A QOS is not a methodology you layer on top of an already overloaded organisation. It is the operational architecture that links measurement to action.
Why Most Plants Measure Everything but Manage Nothing
I have audited dozens of plants that track forty metrics on beautiful digital dashboards, yet still fight the same quality escapes week after week. They measure rigorously, but they do not manage.
Measurement without a predefined reaction is just expensive data collection. Reaction without escalation is firefighting — loud and exhausting, but it never prevents the next fire. In that Slovakian plant, nobody had a defined procedure for what to do when a chart turned red. So they just sat in Monday meetings and hoped.
A functioning QOS breaks this cycle by attaching an expectation, a reaction, and an owner to every single metric on the board.
Standard Reporting vs. a Quality Operating System
What standard reporting does
- Aggregates data for the monthly management review
- Tracks dozens of lagging indicators simultaneously
- Leaves problem-solving to ad hoc assignment
- Treats the dashboard as an informational endpoint
What a QOS does
- Pushes real-time data to the shop floor for immediate use
- Tracks 5-7 critical leading indicators per shift
- Triggers standardised problem-solving automatically
- Treats the board as a trigger for operational action
The Metric Cascade: From Line to Boardroom
The foundation of a QOS is hierarchical measurement. At the line level, you track what the operator directly controls: scrap, cycle time, downtime, and safety. At the department level, supervisors monitor aggregates like OEE, first pass yield, and the cost of non-quality. At the leadership level, the focus shifts to strategic indicators: customer PPM, on-time delivery, and overall quality costs.
The connecting rule is traceability. Every high-level metric must have roots in the shop floor. If customer PPM spikes, leadership must be able to trace the deviation immediately down through the department OEE to the specific line, process, and parameter that caused it.

Cadence and Visual Management
Every tier of the organisation operates on a strict rhythm designed to solve problems at the lowest possible level in the shortest possible time. Daily shift meetings take 15 minutes, standing at the board. Weekly department reviews take 45 minutes to analyse trends and allocate resources.
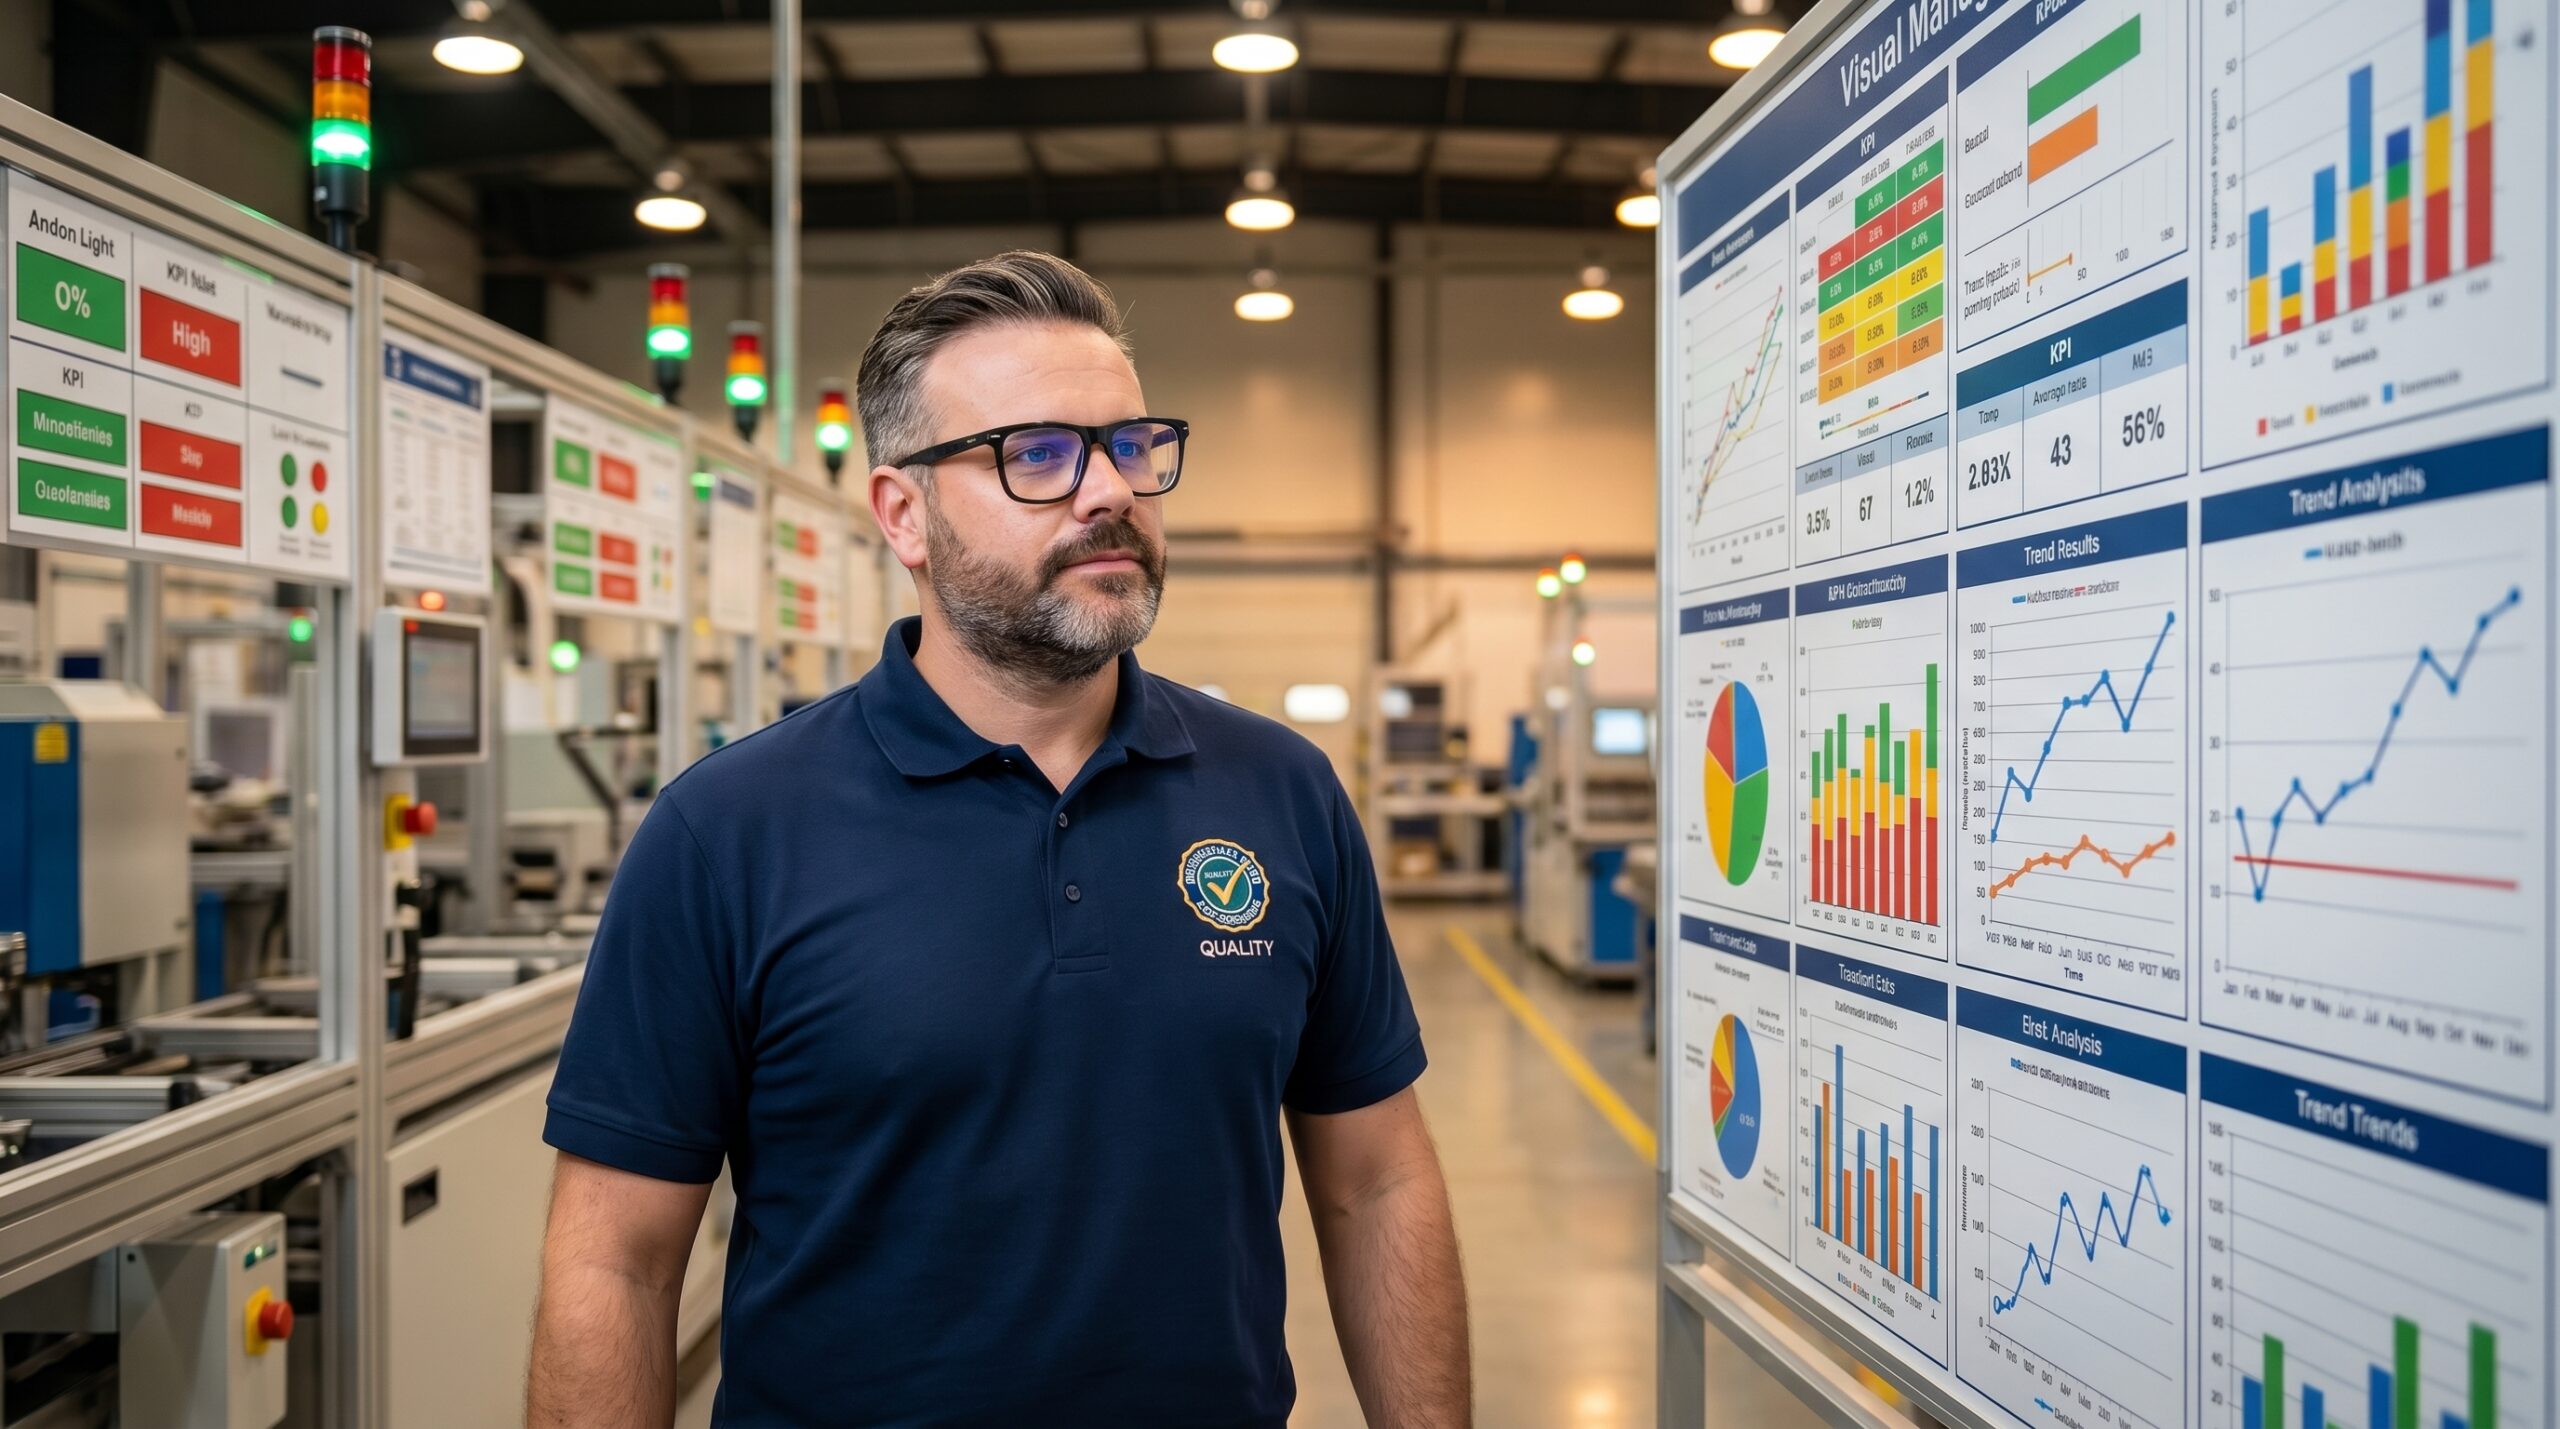
Visual management is the engine of this cadence. A QOS board is not a decoration; it is a working tool. It displays actuals versus targets, recent trends, open issues, assigned actions, and deadlines. It must be a living document, updated daily and driven by the operators who own the process.
The most common failure mode here is overcomplicating the display. If you measure 30 things on a single board, you focus on none. The hard rule is a maximum of 5-7 metrics per line, and 6-8 at the plant level. Every metric must answer one question: if this changes, will we do something differently?
Standardised Reaction and Escalation
When a metric breaches its limit, the QOS demands a standardised reaction. Not an email, not a meeting — a predefined containment and root cause analysis. In practice, the cycle runs from immediate detection and containment through systematic root cause analysis (using 5 Whys or A3), into permanent corrective action, verification, and finally standardisation.
Critically, the system defines when an issue must escalate. Not every problem can or should be solved by the line operator. Escalation thresholds must be objective, written, and visible.
Measurement without a predefined reaction is just expensive data collection.
| Status | Trigger Definition | Required Action |
|---|---|---|
| Green | Metric within target, normal variance | Standard process run by operator |
| Yellow | Metric drifting toward limit | Line leader requests engineering or maintenance support |
| Red | Limit breached, safety or customer impact | Immediate management escalation, crisis team formed |
Building the System in 90 Days
When we deployed a QOS at that Slovakian plant, we stripped 15 lagging plant KPIs down to 6 strategic metrics, supported by 18 operational metrics at the line level. Every metric received an owner, a target, and a red limit.
We built physical boards at each line — paper and marker, no screens. We instituted 15-minute daily stand-ups. The first week, the operators were silent. By the second week, they pointed at the charts. By the third week, they proposed solutions. We trained line leaders in A3 and deployed a clear escalation matrix.
The results were a direct function of visibility. Because people saw the numbers and understood the reaction required, scrap dropped by 34%. Customer complaints fell by 22% because deviations were contained before shipment. Average problem-solving time collapsed from 14 days to 3.
Digital Tools Accelerate, They Do Not Replace
Digital dashboards, automated data collection, and predictive analytics are valuable. They accelerate a functioning QOS. They cannot build one.
If your operators do not know what to do when a metric turns red, a live data feed will only inform them of their failure faster. Start with a manual paper system. Once the manual process works reliably and the behaviour is embedded, digitalise it.
QOS Maturity Progression
- Level 1: ReactiveYou measure, but you only react after the customer complains or the line stops.
- Level 2: ActiveBoards and meetings exist, problems are solved systematically, but firefighting still dominates prevention.
- Level 3: ProactiveTrends are identified and corrected before they breach limits. Predictive maintenance takes hold.
- Level 4: AdaptiveThe system learns continuously. The organisation operates as a self-correcting organism.
Start Small, Scale Deliberately
Do not attempt to roll out a QOS across an entire plant simultaneously. Pick a pilot line — ideally one with visible room for improvement and a shift leader who wants to drive change. Define three to five critical metrics for that specific process. If you could only measure three things, what would they be?
Build a physical board. Institute the 15-minute daily meeting. Ask three questions: What happened yesterday? What is the risk today? Who needs help? When a deviation occurs, use a simple A3 or 5 Why analysis. Do not wait for perfection. Perfect the process through use, learn, and scale to the next line.
A QOS is not a project; it is how you run the plant. The plant director who called me that Sunday evening no longer sits through Monday reviews full of red numbers. His operators know their targets, react to deviations, and escalate systematically. His leadership meetings are focused on how to improve what already works.