Your PPAP documentation, SPC charts, and FMEA analyses are built to answer one question: did we build the product correctly? They verify conformance to specification under assumed, steady-state conditions. This is the fundamental limitation of standard frameworks like IATF 16949 and AS9100. They are backward-looking compliance tools.
The real world does not operate within your control limits. Suppliers ship material drifting just inside the tolerance band. Ambient temperatures swing drastically between shifts. Hydraulic pressure drifts downward over six months, and nobody notices because the parts still pass final inspection. Conformance tools detect variation, but they cannot tell you what happens when multiple variations compound and converge simultaneously.
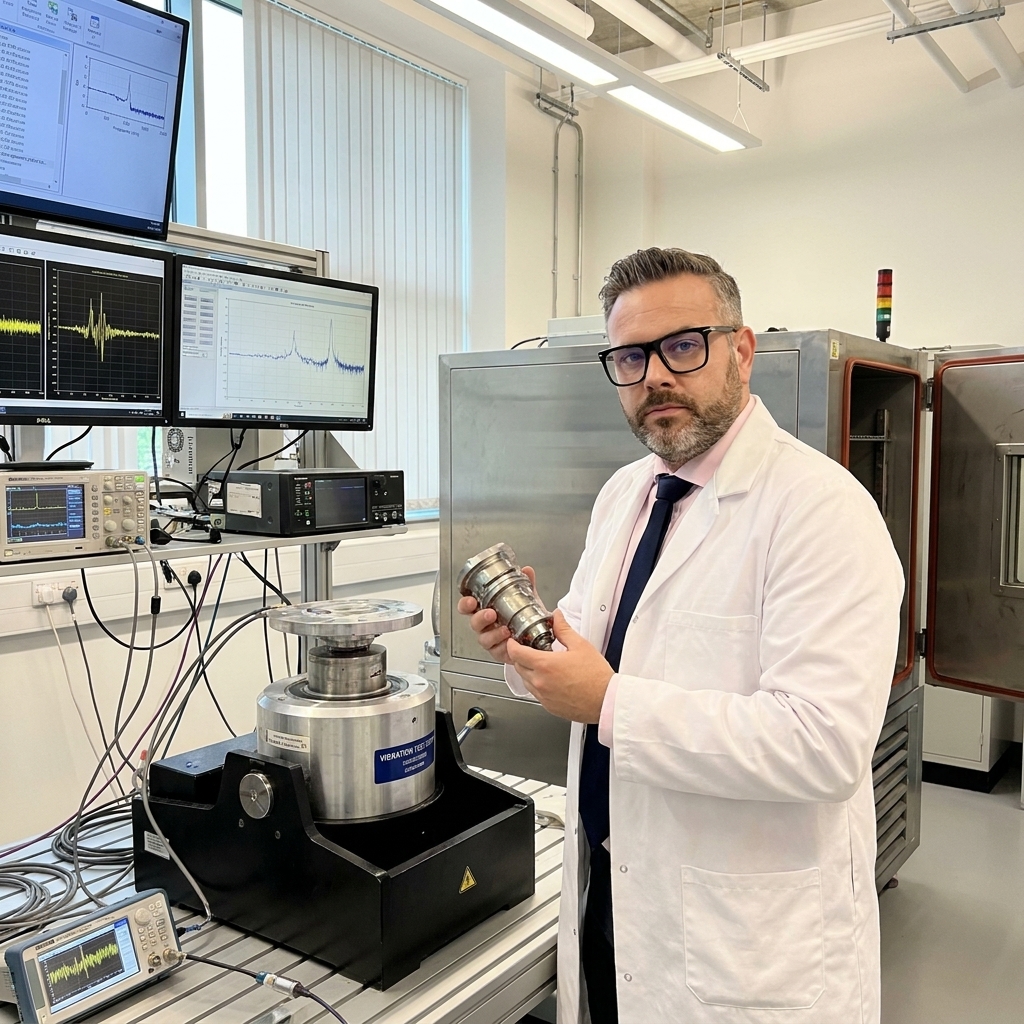
Quality stress testing is the deliberate practice of pushing products and processes beyond their normal operating conditions. The goal is not destruction. It is the discovery of where your system actually breaks, and how much genuine margin exists between a passing dimensional check and a catastrophic field failure.
The Limitation of Normal Conditions
Standard quality systems live in a comfortable fiction. Process capability studies assume stable inputs. Control plans assume steady-state machinery. Your FMEA assumes you can anticipate every single failure mode logically. If your audit score is above ninety percent, the system is deemed healthy, regardless of hidden vulnerabilities.
This conformance mindset is comforting, tidy, and highly dangerous. The most catastrophic quality failures are rarely single-mode. They emerge from the interaction of factors you assumed were independent. Dimensional variation combined with thermal expansion and a minor material lot change produces a failure that none of those variables would trigger alone.
Aerospace and pharmaceutical industries understand this implicitly. EASA regulations demand accelerated life testing and vibration profiles simulating decades of turbulence. FDA sterile packaging requirements mandate bubble point tests and microbial ingress studies. Many automotive Tier suppliers, however, still rely on lot acceptance sampling, treating quality as conformance rather than resilience.
Mapping True System Boundaries
Every specification has a tolerance based on engineering analysis and historical data. The distance between your process mean and the specification limit is your statistical margin. Most organizations measure this through Cpk and Ppk indices, feeling secure when the number surpasses 1.33. But Cpk only describes statistical performance under normal conditions.
Stress testing maps the actual physical boundaries of your system. It reveals whether your safety margin is a wide highway or a tightrope. I have audited plants that boasted a Cpk of 1.67 on critical wall thickness, yet the parts cracked after two hundred thermal cycles. The statistical margin was robust. The physical margin was zero.
The organization simply did not know their true margin because they never tested simultaneous worst-case conditions. Mold temperature ran at the high end, material viscosity at the low end, and cooling time at the absolute minimum cycle limit. Each parameter individually passed inspection. The combination produced residual stress that only surfaced at the customer's assembly plant.
The Margin Illusion
Categories of Deliberate Stress
Stress testing is not simply testing harder. It is a structured methodology exposing specific vulnerabilities. Environmental testing subjects products to conditions beyond specification edges: thermal shock transitions of one hundred degrees Celsius in seconds, and humidity exposure at ninety-five percent relative humidity. The goal is to compress years of degradation into days.
Mechanical testing includes vibration profiles, shock drops, and fatigue cycling. If your product gets installed with a hammer when the instructions say hand-tight, mechanical stress will expose the failure. Electrical testing applies overvoltage, reverse polarity, and electrostatic discharge to circuits. Process testing stresses the production system itself, revealing hidden dependencies.
Process stress testing is the most overlooked and potentially valuable category. What happens when you reduce cycle time by twenty percent? What happens when a new operator runs the line, or when you skip every other inspection point? This discipline reveals the fragile assumptions baked into your standard work.
Building a Stress Testing Programme
Starting a programme does not require a multimillion-euro test lab. It requires a shift from asking if a part meets specification, to asking what it would take to make that part fail. You begin by identifying critical characteristics using your PFMEA, warranty data, and shop-floor intelligence. Focus strictly on parameters where failure causes the most harm.
Define the stress profiles for those characteristics. Combine environmental factors, mechanical loads, and process variations that compound risk. Design tests using accelerated models like Arrhenius for temperature degradation or Coffin-Manson for thermal-mechanical fatigue. Run the tests and rigorously document every failure mechanism you provoke.
The value lies entirely in the failures, not the passes. A broken part is intelligence revealing exactly where your design is vulnerable. If a test shows that transport vibration causes a fatigue crack after five hundred kilometres, redesign the packaging immediately. Stress testing that does not change your control plan is mere theatre.
Deploying a Targeted Stress Test
- 01Identify CharacteristicsExtract from PFMEA, warranty data, and known high-risk dimensional tolerances.
- 02Define Worst-Case LimitsMap combinations of parameters sitting simultaneously at their extreme tolerance edges.
- 03Execute Accelerated TestingApply thermal, mechanical, or process stress to compress degradation timelines.
- 04Feed Failures to APQPTranslate discovered failure mechanisms directly into updated control plans and PFMEA severity ratings.
Calculating the Return on Broken Parts
Skeptics argue that stress testing is expensive. Test equipment costs capital. Sample preparation consumes engineering hours. Production downtime for process stress testing disrupts delivery schedules. These costs are real and measurable.
A customer line stoppage costing two million euros per day is also measurable. So is a warranty claim rate that triples because an undocumented material substitution failed after six months of UV exposure. The cost of implementing a thermal cycling chamber is negligible compared to losing a major contract because a competitor provided superior accelerated life testing data.
Stress testing calculates return on investment in failures prevented and customers retained. It shifts the organizational mindset from conformance to resilience. A passing test result is no longer the end of the conversation; it is the prompt to ask what harsher condition might finally break the product.
The most dangerous quality failures emerge from the interaction of factors you thought were independent.
Immediate Implementation Steps
You do not need a capital project to begin stress testing this week. Pick your highest-volume or highest-risk product family and identify its three most critical quality characteristics. These are the dimensions that surface disproportionately in customer complaints and keep your quality engineers awake at night.
Design one stress test for each characteristic that pushes it beyond normal conditions. If the concern is dimensional stability, cycle the parts between an industrial oven and a freezer, then measure. If the concern is bond strength, test the material after sustained humidity exposure. Use existing equipment.
Run the test and honestly evaluate the results. If the parts fail, you have discovered a lethal vulnerability that your standard quality system was completely blind to. If the parts pass, you now possess empirical data proving your margin is real. Use that data to prove robustness to your customers.
Stop asking whether your organization built the product correctly. Start asking what combination of stress factors it would take to break it on purpose. That single question will save your organization from the financial and reputational damage of discovering your actual margin during a 2:00 AM phone call from an OEM customer.