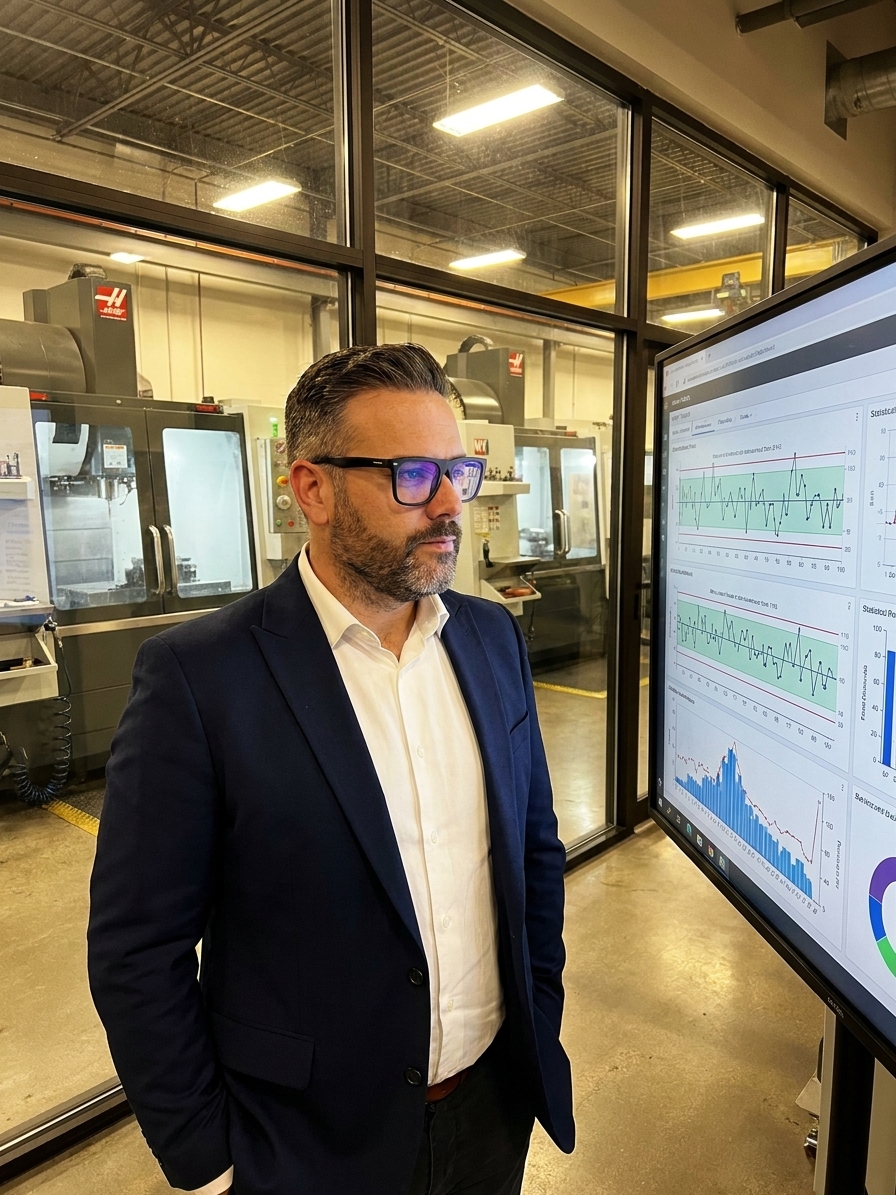
A precision machining facility supplying transmission housings to automotive OEMs hits a 4.7% scrap rate, nearly double the target. The executive team flies in a task force, mandates daily stand-ups, threatens shift supervisors, and installs a real-time SPC dashboard. Six weeks later, scrap drops to 2.1%. The task force declares victory, the dashboard vendor publishes a case study, and the supervisors receive bonuses.
What nobody asked was what would have happened if they had done nothing. The scrap rate would almost certainly have fallen on its own. The 4.7% was an extreme outlier, driven by a large component of random fluctuation on top of the true process variation. That random component corrects itself. The task force took credit for a mathematical certainty they neither created nor controlled.
Then they institutionalised the intervention. The daily stand-ups became permanent. The promoted executive applied the same crisis playbook to every department that had a bad month. Within a year, the plant was drowning in reactive meetings, chasing noise instead of signal, and burning through supervisors who quit rather than endure another emergency response to what was, statistically, weather.
What Regression to the Mean Actually Is
Francis Galton described regression to the mean in 1886 when he noticed that tall parents tended to have children shorter than them, though still above average. The extreme cases, he realised, were partly extreme because of random factors, and those random factors do not persist. The same mathematical principle governs every metric in your quality system.
Any measurement you take, whether scrap rate, cycle time, customer complaints, or audit findings, is a combination of two things. First, the true underlying performance of your process. Second, random variation, the statistical noise that pushes any single data point higher or lower than the true value.
When you measure at an extreme, a very good month or a very bad one, the random component is likely pushing the number away from average. Next time you measure, that random push will probably not be as strong. The next measurement will be closer to the historical average. This is a mathematical fact, not a theory. It happens everywhere, in every process that has variation.

Why Quality Organizations Keep Falling Into the Trap
Quality professionals are trained to react to signals. SPC teaches us to distinguish special cause from common cause variation. Control charts give us rules for when to investigate and when to leave the process alone. But most organizations do not actually use SPC correctly. They track metrics on dashboards, compare this month to last month, set targets, and punish deviations.
In this environment, regression to the mean becomes a trap with three jaws. The first is the illusion of effective intervention. When a metric spikes and you intervene, the metric will likely improve, not because your intervention worked, but because extreme values naturally become less extreme. You get positive reinforcement for action, regardless of whether the action was useful.
The second jaw is the illusion of ineffective process. When a metric is unusually good and you do nothing special, it will likely get worse. You interpret natural regression as evidence that you cannot sustain improvement. The third jaw is the superstition cycle. Over time, organizations build entire management systems, escalation procedures, and incentive structures based on patterns that are mostly statistical noise.
Statistical Noise vs. Genuine Process Shift
What teams react to
- Single-month spike triggers an immediate task force
- Scrap drops the following month, intervention credited
- Action is praised and institutionalised as best practice
- Management targets the metric, not the process capability
What statistical rigour requires
- Control limits define the boundary of common cause variation
- Points outside limits demand root cause analysis
- Intervention is evaluated over a multi-month time series
- Sustained capability gains, not random bounces, drive rewards
The Supplier Scorecard Disaster
I worked with a Tier 1 automotive supplier that scored 47 active vendors on a 100-point quality scorecard. Any supplier scoring below 80 received a corrective action request. Any supplier scoring below 70 for two consecutive months was placed on probation. Suppliers scoring above 95 received preferred status and volume bonuses. The quality team presented this system at conferences.
When I analyzed 24 months of scorecard data, a clear pattern emerged. Suppliers who received corrective action requests almost always improved the following month, by an average of 11 points. The team cited this as proof their intervention worked. But suppliers who scored above 95 almost always dropped the following month, by an average of 8 points. The same suppliers cycled through corrective action and preferred status repeatedly.
The scores were bouncing around their true average capability, and the management system was taking credit for the bounces. The company was spending approximately 200 hours per month administering a response system that was mostly chasing its own tail. The fix was not to stop monitoring suppliers, but to stop treating every monthly score as a reliable signal.
We implemented 90-day rolling averages, tightened the criteria for escalation to require sustained deviation, and eliminated the immediate corrective action trigger for single-month drops. The quality team's workload dropped significantly, and supplier performance, measured correctly, stayed the same. The intervention was never driving the improvement. The mathematics were.
The Inspector Performance Paradox
Consider a final inspection team that catches an average of 12 defects per shift. One shift, they catch 22, nearly double. Management praises their vigilance. The next shift, they catch 14. Management says they are losing focus. The third shift, they catch 9. Now there is a disciplinary meeting. What happened? Probably nothing. The 22 was an outlier, driven by a bad batch of material or random clustering.
The subsequent shift back toward 12 is regression, not decline. But the inspector has now been through an emotional cycle of praise and punishment that had nothing to do with their actual performance. Over time, this destroys morale and encourages gaming, specifically under-reporting defects to smooth the numbers.
The corrective action that 'worked' because the metric improved might have simply been the process correcting itself.
I have seen this pattern in aerospace non-destructive testing, pharmaceutical batch review, and electronics manufacturing. Anywhere humans are measured on count data with natural variation, regression to the mean will punish them for normal fluctuations and reward them for random spikes in the opposite direction. It drives the best inspectors to find jobs where they are not managed by statistical illiterates.
The Training Program That Worked
A medical device company invested heavily in a comprehensive quality awareness training program for production workers. They measured a 3.8% defect rate before the training and a 2.4% defect rate after. The training manager declared a massive improvement. The CFO approved a budget expansion, and a white paper was written.
But the baseline was an outlier. The 3.8% was measured during a particularly bad month where a new material lot, several inexperienced temps, and a specification change coincided. When you pulled back the timeline, the process was already trending upward before training began. The 2.4% measured afterward was well within the historical range of normal performance.
The training might have contributed, or the process might have simply regressed to its true capability. The measurement system could not tell you, because it was designed to compare two points in time rather than understand the process trajectory. Real process improvement shows as a sustained shift in the process average, not a bounce from a low point.
Validating an Intervention Against Regression
- 01Establish the baselineMap the process capability and control limits over multiple months before any intervention.
- 02Identify the triggerConfirm the problem is a genuine special cause, not a random outlier within existing limits.
- 03Isolate the variablesApply the intervention to a specific line or shift while holding a control group steady.
- 04Measure the shiftTrack the timeline to see if the process mean actually shifts, or if it simply regresses to average.
- 05Scale or discardInstitutionalise the change only if the sustained mean proves the intervention worked.
How to Stop Being Fooled
Recognizing regression to the mean does not mean becoming passive. It means becoming smarter about when to act and how to measure. The single most common analytical mistake in quality management is comparing one period before an event to another period after, then attributing the difference to the intervention. This is how superstitions are born and institutionalized.
Never evaluate an intervention based on before-and-after comparison alone. Use control charts to show whether the process actually shifted rather than just fluctuated. Take multiple measurements before and after. Use control groups when possible, parts of the process that did not receive the intervention. Look at long enough time windows that random variation averages out.
Before reacting to any metric change, ask whether the deviation falls outside the normal range of variation. If you do not know the normal range, build the control chart first. If a change produces an immediate 30% improvement, your first question should be whether the baseline was artificially bad, not how to scale the solution.
Finally, stop punishing random variation. If your performance management system rewards people when metrics are good and punishes them when they are bad, and those metrics carry significant random variation, you are systematically punishing people for things outside their control. This teaches people to game the system, hide bad data, and manipulate measurements rather than improve the process.