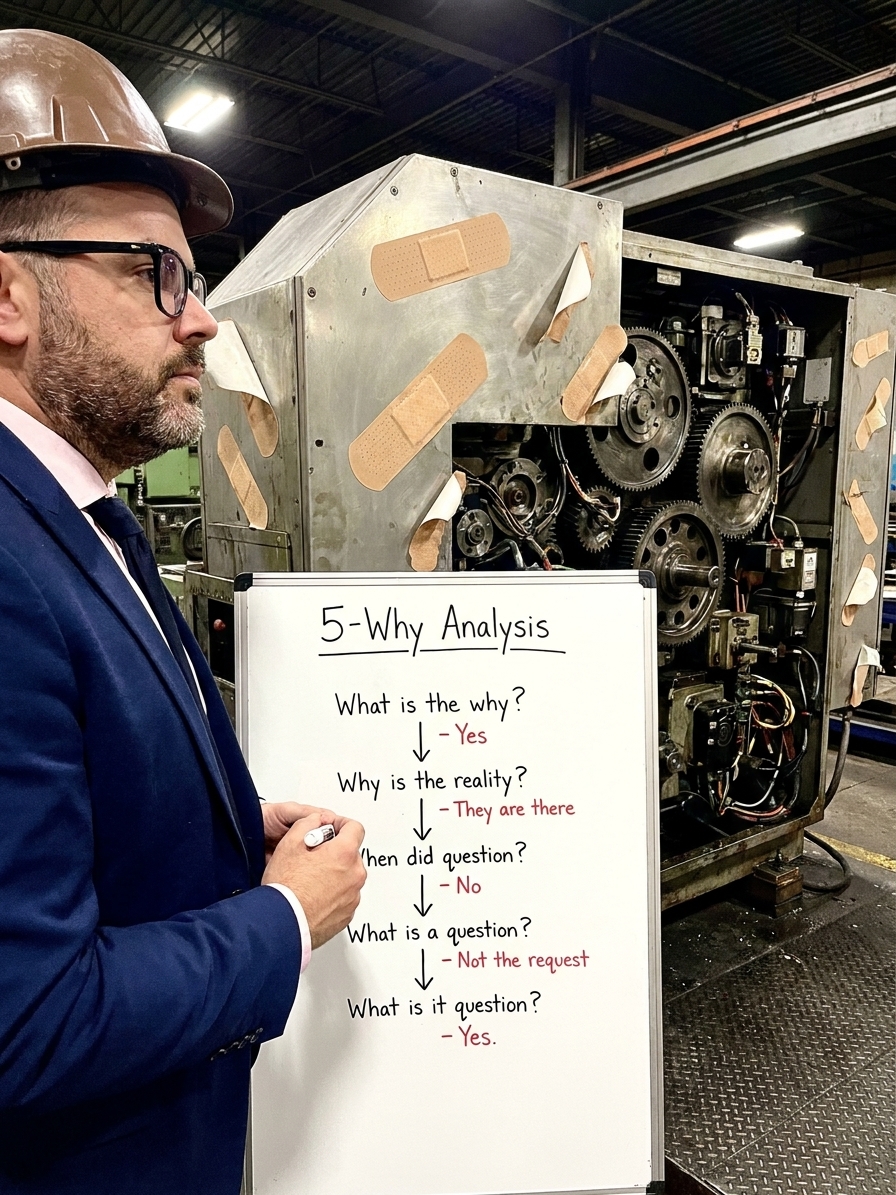
Every manufacturing plant has a problem that never dies. It surfaces in shift handovers, dominates weekly quality reviews, and survives every 8D cycle thrown at it. I have audited plants where the same defect has been 'solved' four times in eighteen months, each closure generating a fresh corrective action record and zero actual prevention.
The failure is rarely the toolset. Organisations have 5 Whys, fishbone diagrams, and IS/IS NOT matrices. They have IATF 16949 or AS9100 certification. The failure is the stopping rule: the investigation halts at the first cause the team can fix with a procedure change, and the real driver remains untouched.
Symptom treatment feels productive because it generates measurable short-term results. The defect rate dips. The customer stops complaining. The CAPA log shows 95% closure. But the metric nobody tracks — recurrence within 90, 180, and 365 days — reveals the truth: the problem was paused, not solved.
The Symptom Trap in Practice
A customer reports burrs on a stamped edge. The team investigates and finds the deburring station was skipped on third shift. The corrective action is predictable: retrain the operator, add a verification signature, update the work instruction. The 8D is closed and filed.
Three weeks later, the burrs return on a different shift with a different operator. This time, investigation reveals the deburring tool wore out faster than expected. Corrective action: reduce the tool replacement interval from monthly to biweekly. Case closed again.
Two months later, the problem resurfaces. Now the upstream stamping die is leaving a larger burr because the cutting edge is chipping. Corrective action: tighten die inspection criteria. Each investigation found something real. Each action addressed something true. But each one treated a manifestation of a deeper system problem that nobody reached.
This is the symptom trap. The organisation becomes expert at dressing wounds and incapable of preventing them. The CAPA database grows, the audit trail looks clean, and the fundamental defect continues corroding quality from the inside.

Why Symptom Treatment Feels Like Progress
Symptom treatment is seductive because it produces visible, quantifiable effects. After you retrain the operator, the burrs stop for two weeks. After you increase the tool change frequency, they stop for a month. The Pareto chart dips. The customer placation call succeeds. The corrective action gets signed off.
This generates organisational addiction to activity-based problem-solving. The CAPA log is full. The closure rate is high. Auditors see a robust system. But the metric that would expose the illusion — recurrence rate — is absent from almost every management review I have encountered.
Without recurrence tracking, the organisation cannot distinguish between a root cause fix and a symptom treatment. Both look identical on the closure record. Both generate the same documentation. Only time separates them, and time is the one variable the system refuses to measure.
The consequence is predictable. Problems go dormant until the bandaid slips, then the cycle repeats with a new investigation number, a new team, and the same unaddressed cause continuing to generate cost.
The Five Layers of Causation
Genuine root cause analysis requires a mental model that most manufacturing organisations lack: problems have multiple layers of causation, and stopping at any layer except the deepest means you are treating a symptom. Consider a CNC machining centre producing out-of-tolerance parts. The layers stack with increasing discomfort at each level.
The immediate symptom is the out-of-tolerance part — what the inspector catches, what triggers containment. The direct cause is tool offset drift during the machining cycle. Fixing this means recalibrating offsets and adding an in-process check. This is where the majority of investigations stop, and it is exactly why the majority of problems recur.
The proximate system cause sits deeper: the thermal compensation algorithm was not updated after a controller software patch, causing dimensional drift as the spindle warms. Fixing this feels like root cause because it involves a technical failure, but it is not the bottom. Deeper still is the management system cause: the software update was deployed without validation of thermal behaviour because the engineering change process did not require it.
At the bottom is the cultural root: the organisation prioritises fast deployment over thorough validation because maintenance is measured on machine uptime, not change reliability. The incentive structure actively discourages the deep work that prevents recurrence.
Layers of Causation in Manufacturing Defects
- Layer 1: Immediate symptomOut-of-tolerance parts. What the customer sees and what triggers containment action.
- Layer 2: Direct causeTool offset drift during the cycle. Addressed by recalibration and in-process checks.
- Layer 3: Proximate system causeThermal compensation algorithm not updated after a controller patch. A technical failure.
- Layer 4: Management system causeEngineering change process did not require post-update validation. Genuine root cause territory.
- Layer 5: Cultural rootIncentive structure rewards fast deployment over reliable change. The true driver.
Why the 5 Whys Fails in Practice
Most organisations already possess the tools for genuine root cause analysis. They have been trained on 5 Whys, fault tree analysis, and IS/IS NOT matrices. The posters are on the wall. The tools are not failing — the mindset is failing, and the 5 Whys technique exposes this with brutal clarity.
Used correctly, 5 Whys forces investigators through each layer of causation until they reach a system or cultural driver. In practice, the technique drifts sideways instead of drilling downward. An investigation into operator-skipped deburring ends at 'the maintenance procedure is inefficient' — a conclusion that went horizontal into maintenance rather than vertical into why a production quota exists that pressures operators to bypass quality steps.
The tool produced five layers of symptoms arranged in a vertical list. The thinking failed because the investigator was trained to find a fixable cause, not a fundamental one. The 5 Whys in the hands of someone who thinks in symptoms simply produces a more elaborate symptom.
The fix is not better tool training. The fix is changing the stopping rule that governs when an investigation is considered complete. If the cause you found can be addressed with a procedure update, you have not finished — you have started.
Three Warning Signs of Symptom Treatment
The first signal is repetitive root cause classification. If your CAPA database shows 'operator error' as a root cause across multiple investigations, your organisation is treating symptoms. Operator error is never a root cause. It is evidence of a system that allows or encourages the error. When 'retrain operator' appears more than once for the same failure type, you have a system problem that nobody is investigating.
The second signal is the nature of the corrective actions themselves. If your closures consist predominantly of updated work instructions, new checklists, additional inspection signatures, and revised training materials, every action is a Layer 2 intervention. Real root cause corrective actions involve changes to equipment design, process flow, measurement systems, poka-yoke devices, or incentive structures.
The third signal is the absence of recurrence data. If your management review does not report the percentage of closed CAPAs whose problems returned within six or twelve months, the organisation is more interested in closing cases than solving problems. The absence of recurrence tracking is itself a system-level symptom.
Operator error is never a root cause. It is a symptom of a system that permits the error to occur.
The Financial and Cultural Cost
The financial impact of symptom treatment is staggering, though it hides across so many budget lines that no single report captures it. Investigation labour, containment, scrap, rework, customer returns, line stoppages, and expedited shipping accumulate every time a dormant problem resurfaces.
Layered on top are the accumulated verification steps — each new check, signature, and approval added to prevent symptom recurrence. These layers act as organisational scar tissue. They slow production without adding real quality value, and they are almost never removed even when the underlying cause is eventually addressed.
The most damaging cost is cultural. Every time a team implements a corrective action and the problem returns, credibility bleeds away. Engineers become cynical. Operators become dismissive. Managers become defensive. The phrase 'root cause analysis' becomes a punchline, and the organisation's capacity for genuine problem-solving atrophies until nobody believes lasting prevention is achievable.
What a CAPA System Should Track
Breaking the Cycle
Escaping the symptom trap requires three deliberate structural shifts in how investigations are governed. The first is changing the stopping rule. The new standard must be: keep investigating until you find a cause that, if addressed, would make the entire category of problem impossible — not just this specific instance.
The second shift is requiring Layer 4 or 5 thinking in every formal investigation. Every 8D or CAPA record must document the management system cause before it can be closed. This does not mean every action must reorganise the company. It means the system-level driver must be identified and recorded, creating a pattern database that reveals where systemic intervention is needed.
The third shift is mandatory recurrence tracking at 90, 180, and 365 days. If the problem returns, the original investigation was incomplete by definition. This feedback loop — connecting closure to lasting prevention — is the single most powerful mechanism for forcing the transition from symptom treatment to genuine root cause analysis.
I introduced recurrence tracking at an aerospace supplier and watched the closure rate drop from 94% to 61% in the first quarter. That drop was the healthiest signal the quality system had produced in years. It meant the organisation stopped rewarding speed and started demanding truth. The problems that remained open were the ones that had been silently recurring for a decade.
The choice between treating symptoms and finding root causes is a leadership decision, not a technical one. The tools exist. The methods exist. The knowledge exists. What matters is whether leadership has the will to slow down, surface uncomfortable system failures, and close fewer CAPAs that actually prevent recurrence rather than more CAPAs that document activity. Every symptom treated today is a recurrence investigated tomorrow — with a bigger scope and a higher cost.