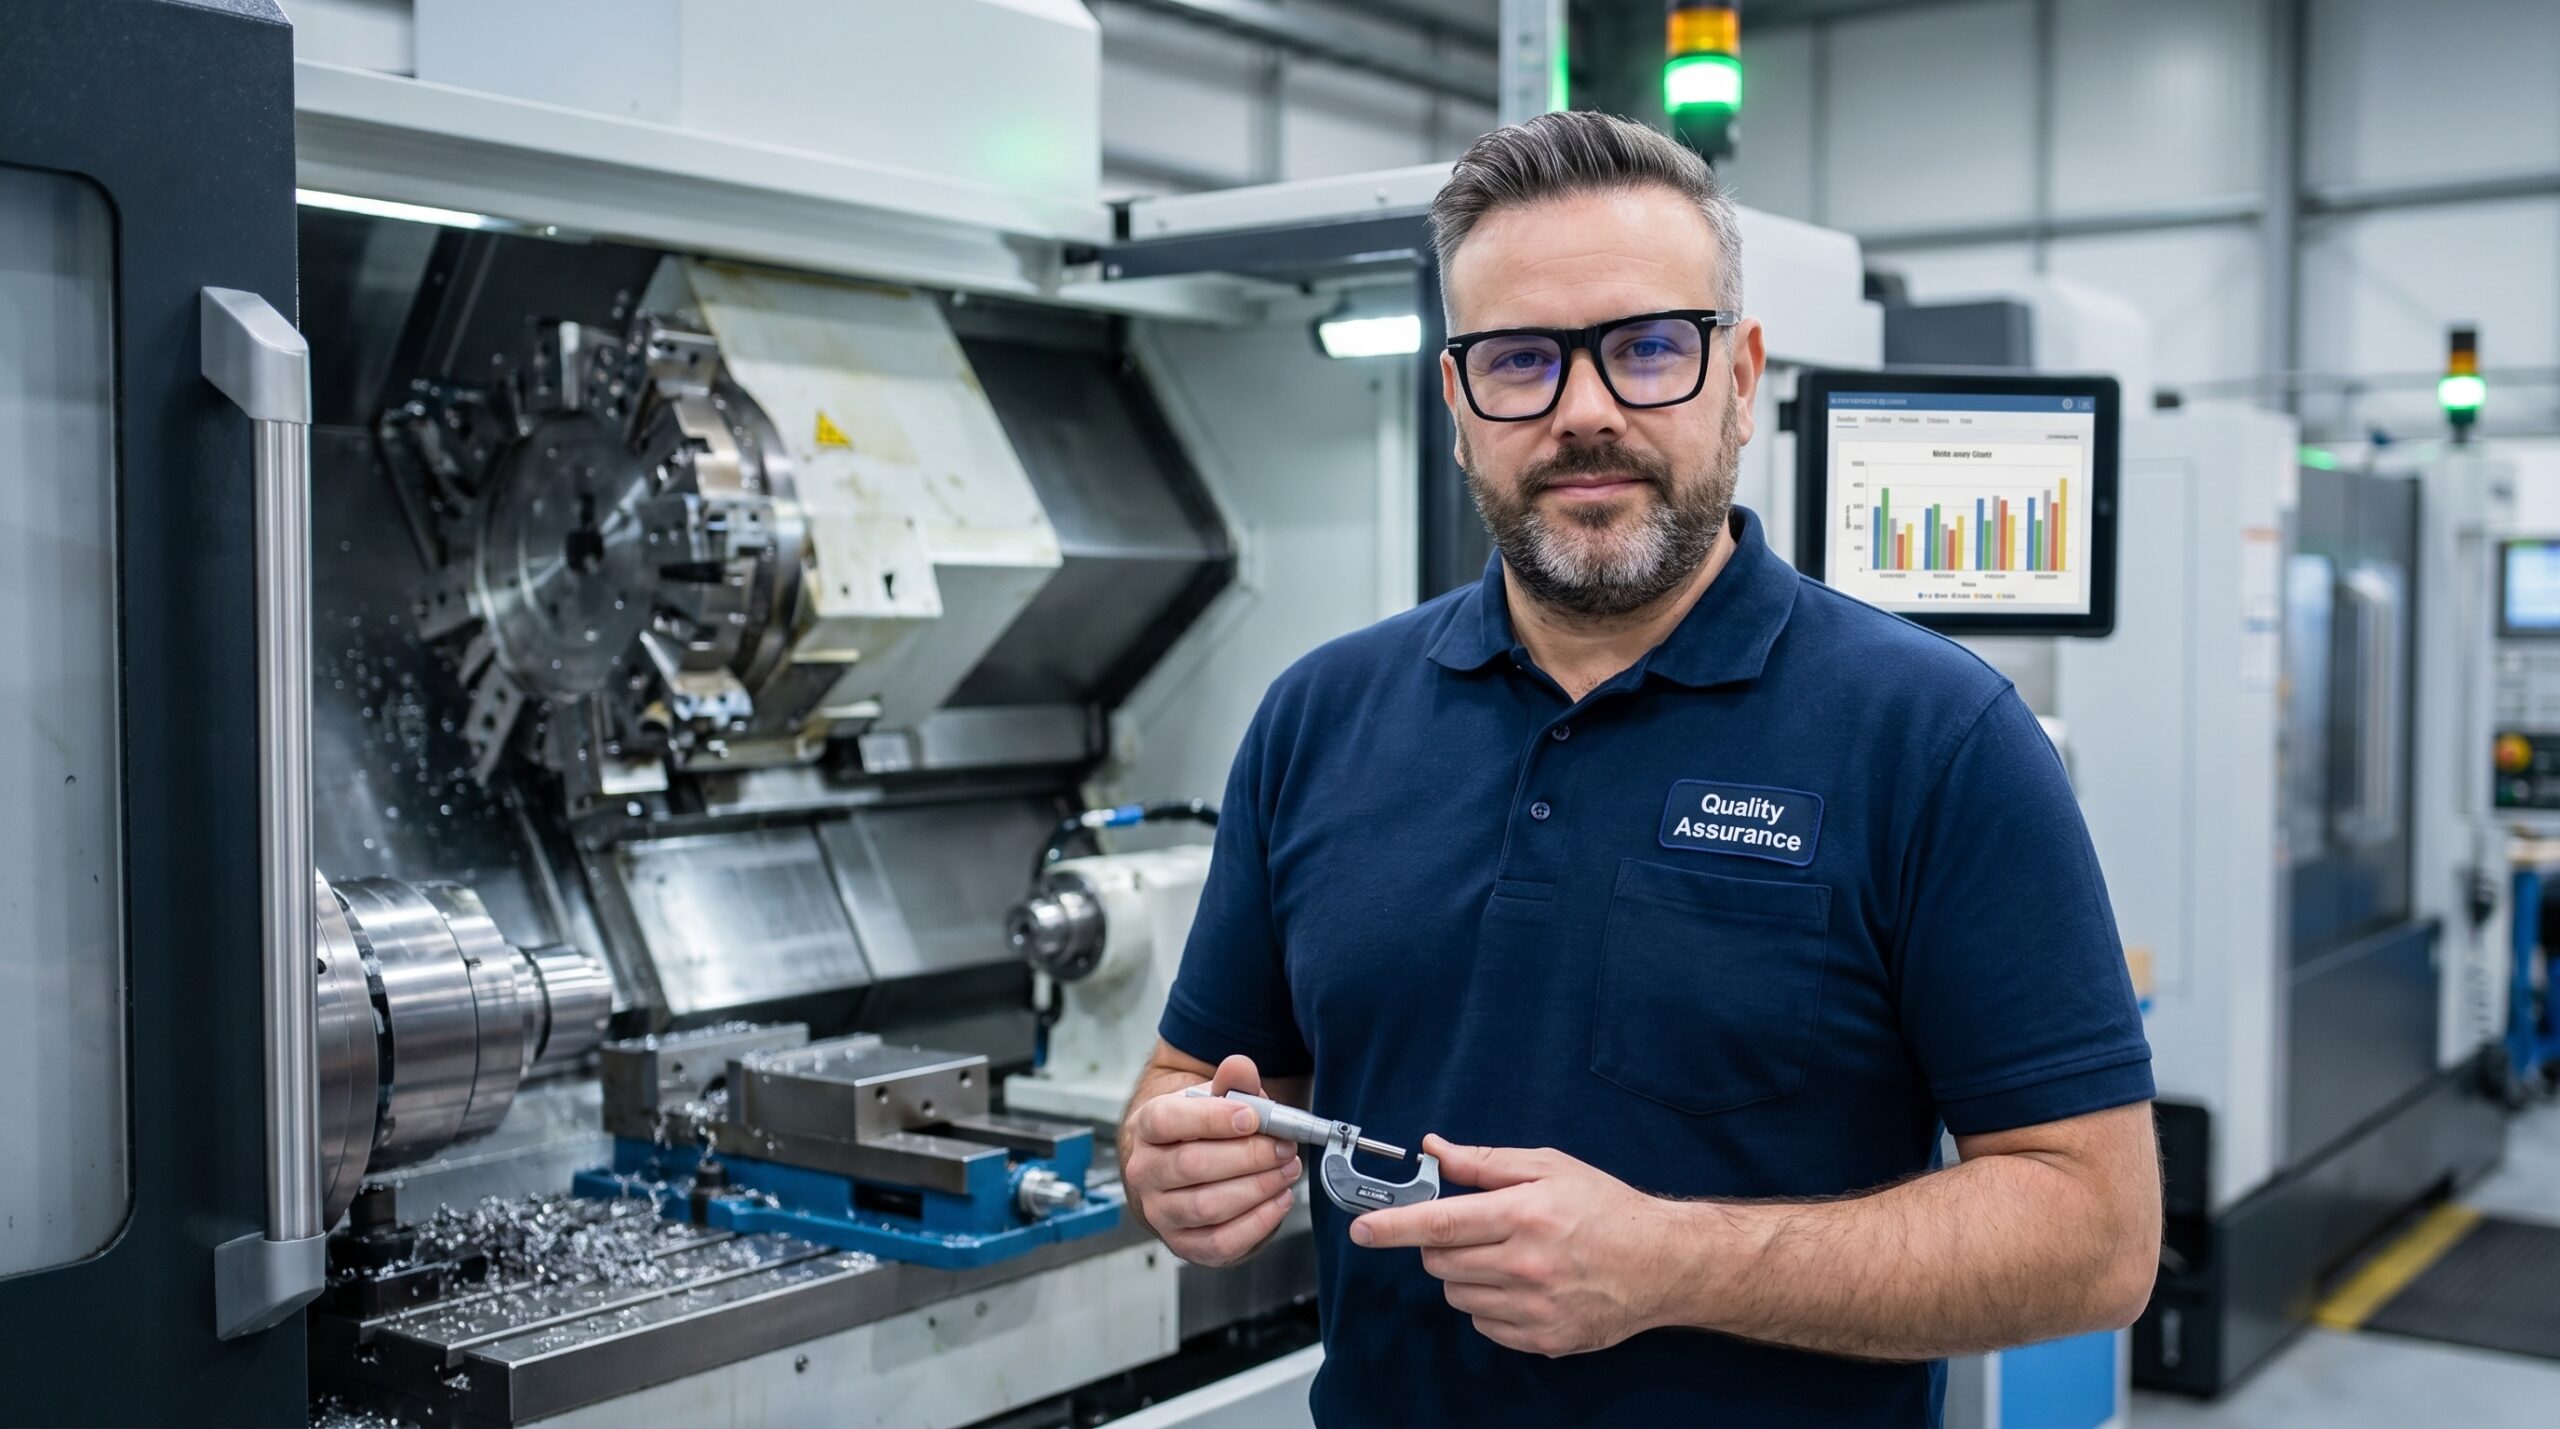
I once took a Friday evening call from a plant director at an automotive supplier. The defect rate on a precision gearbox line had jumped overnight from 0.3% to 4.7%. In IATF 16949 manufacturing, a fifteen-fold spike is not a deviation; it is a crisis that stops shipments. The engineering team in Germany had already scheduled a deployment, estimating ten days just for root cause analysis.
I told the director to secure the physical parts from that shift. We needed the ten best units and the ten worst units isolated on the bench. We did not need a cross-functional meeting room filled with subjective hypotheses. We needed the parts, because the parts know exactly what went wrong.
By Sunday afternoon, we had identified the mechanical deviation, verified the corrective action, and confirmed the fix. The Red X was a 0.03 mm micro-movement on a press nozzle. We did not find it faster because we were lucky. We found it because we used the Shainin System, a methodology that replaces speculation with physical comparison.
Stop Brainstorming, Start Comparing
Dorian Shainin built his methodology on a radically simple premise: talk to the parts, not the people. The traditional 8D or DMAIC approach starts with a brainstorming session. Engineers gather around a whiteboard, generate forty-seven potential causes, and then spend weeks verifying hypotheses that are mostly wrong. This wastes capacity and prolongs scrap.
The Shainin method flips this sequence. If you have a population of parts where some are perfect and others are defective, the physical difference between them isolates the root cause. Your opinion is irrelevant. The evidence is machined into the metal, moulded into the plastic, or wired into the electronics.
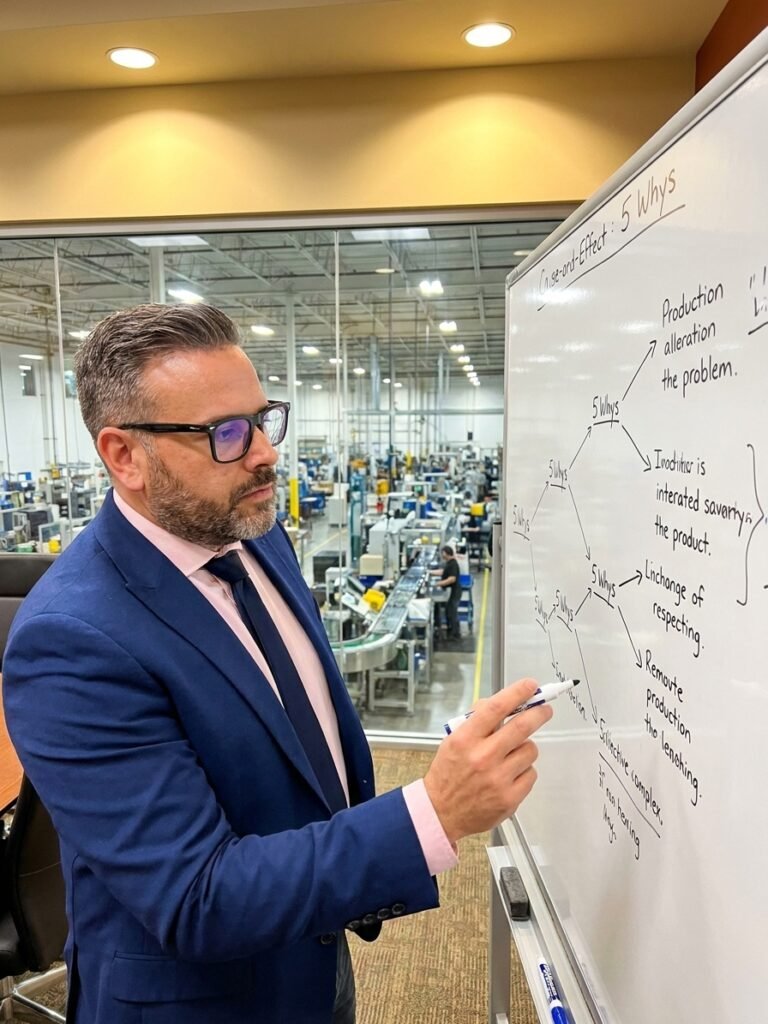
Shainin’s research showed that in manufacturing, variation is rarely distributed evenly. A single dominant variable drives the majority of the deviation. He called this the Red X. When a river is leaking water, you do not inspect every centimetre of the bank. You look for the strongest current. The Shainin System is designed to find that current fast, confirm it mechanically, and move on.
Multi-Vari Charts: Mapping the Variation
The Multi-Vari chart is the entry point of the investigation. It is a visualisation tool that stratifies process variation into three distinct families: within-piece, piece-to-piece, and time-to-time. You collect consecutive samples, plot the measurements, and let the dominant pattern reveal itself.
On a machining line, a team might spend days arguing about tool wear and machine vibration. A Multi-Vari chart constructed in twenty minutes can show that the dominant variation is time-to-time. If the first three parts of every morning shift are out of tolerance, you have immediately narrowed the scope. The issue is thermal stabilisation, not the tool path.
The Shainin Investigation Sequence
- 011. Multi-Vari AnalysisCollect 30-50 consecutive parts to determine if variation is within-piece, piece-to-piece, or time-based.
- 022. Paired ComparisonMeasure the best and worst parts to find the specific parameter that separates them.
- 033. Components SearchIf the product is an assembly, swap components between good and bad units to isolate the Red X.
- 044. B vs. C ValidationProve the fix works by comparing three parts from the new process against three from the old.
Paired Comparison and Component Search
Paired Comparison is the core of the methodology. You take eight to ten of the best parts and eight to ten of the worst parts from the production run. You measure every relevant parameter until you find the distinguishing characteristic. This bypasses the speculation of cause-and-effect diagrams.
I have seen this solve a persistent warping issue in electronic enclosures. An engineering team had spent weeks adjusting injection moulding temperatures and holding pressures. Paired Comparison showed that the only difference between the good and bad parts was pellet moisture. The supplier had switched to a non-sealed packaging format during the summer humidity.
When dealing with complex assemblies, Components Search applies the same logic. You take a fully functional best unit and a defective worst unit. You dismantle them and systematically swap components, testing after each exchange. When the good unit fails or the bad unit corrects, you have mechanically isolated the faulty component.
B vs. C and Pre-Control: Pragmatic Verification
Once you implement a corrective action, you must prove it works. Shainin uses B vs. C (Better vs. Current) validation. Instead of running a full statistical design of experiments requiring thirty or more samples, you test three parts from the current process and three from the improved process.
B vs. C Validation Sample Sizes
Using a structured ranking table, B vs. C provides practical certainty that the new setup outperforms the old one. You do not need statistical significance; you need practical certainty. If the three B parts rank clearly above the three C parts, the improvement is confirmed.
For ongoing process control, Shainin introduced Pre-Control. Instead of calculating X-bar R control limits, the tolerance band is split into green, yellow, and red zones. If a part lands in the red zone, the operator stops the line. It is controversial because it ignores the statistical foundations of SPC, but it is highly effective on shop floors where operators need immediate, calculation-free feedback.
Choosing Between 8D, DMAIC, and Shainin
The Shainin System does not replace your existing quality management framework. IATF 16949 and AS9100 still require formal 8D reporting for customer complaints. Six Sigma DMAIC is still necessary for complex, multi-variable business problems. Shainin is a surgical tool for acute manufacturing deviations.
The best way to understand a process is not to listen to the people who ran it, but to the parts that came out of it.
Use Shainin when a specific dimensional or functional defect appears on the line and every hour of investigation costs thousands of euros in scrap. It is the fastest method for narrowing down a physical root cause. Use DMAIC when you need to optimise a process across a supply chain. Use 8D when the customer demands a standardised, documented corrective action format.
Implementation and Cultural Resistance
If the Shainin System is so effective, its adoption should be universal. It is not, and the reasons are cultural. Engineers are trained to solve problems analytically and creatively. Banning brainstorming and forcing them to measure physical parts feels restrictive to many technical professionals.
There is also a structural barrier. Unlike Lean Six Sigma, with its globally standardised Green Belt and Black Belt certifications, the Shainin methodology is proprietary. Red X is a registered trademark. Organisations cannot easily deploy it through standardised internal training without engaging specialised consultants.
Despite this, manufacturers like General Electric, Rolls-Royce, and Jaguar Land Rover use it as a core problem-solving weapon. You can adopt the underlying principles immediately. On your next line deviation, collect thirty consecutive parts, build a Multi-Vari chart, and compare your eight best units against your eight worst. The parts will tell you exactly what your Ishikawa diagram cannot.