
Six Sigma is not a philosophy. It is a statistical framework for reducing variation to a level where defects become statistically insignificant — fewer than 3.4 defects per million opportunities (DPMO). That translates to a process yield of 99.99966%. In automotive and aerospace manufacturing, where a single defective fastener or weld can trigger a recall or a grounding, that threshold is not aspirational. It is the baseline expectation.
I have implemented Six Sigma across automotive plants, aerospace assembly lines, and heavy-industrial operations holding IATF 16949 and AS9100 certifications. The methodology works when teams treat it as a disciplined sequence of statistical analysis, not as a suggestion box for improvement ideas. The DMAIC cycle — Define, Measure, Analyze, Improve, Control — is the mechanism. Every step has a deliverable, and skipping one guarantees that gains will erode within a quarter.
The discipline replaces opinion with measurement. When a customer reports a field failure, the immediate instinct in most plants is to adjust a machine, retrain an operator, or add an inspection step. Six Sigma forces a different sequence: quantify the defect rate, map the process variables, isolate the statistically significant contributors to variation, and verify the result with a capability study. That discipline is what separates a sustained Cpk improvement from a temporary dip in the scrap rate.
Define and Measure: Establishing the Statistical Baseline
The Define phase sets the project boundary in terms a customer would recognise. A valid problem statement is not "we have a quality issue on Line 3." It is: "Field returns for the last quarter show 1,200 PPM on the brake-caliper assembly, against a customer PPM target of 50." The statement must be quantified, bounded, and tied to a measurable cost of poor quality. Without that anchor, projects drift into scope creep and never reach the statistical analysis that drives real improvement.
Measure is where most projects fail. Teams rely on downstream inspection records instead of measuring the process parameters that produce the defect. A capable Measurement Systems Analysis (MSA) is the prerequisite here. If your gauge R&R exceeds 10% of total variation, the data you are analysing contains more measurement noise than process signal. I have seen projects spend six weeks in Analyse working on false correlations because the Measure phase never validated the data source. Fix the measurement system first, then collect baseline data.
The output of Measure must include a baseline Cpk or sigma level. If the current process is operating at Cpk 0.8, you know the variation is excessive and the mean is likely off-target. If it is at Cpk 1.1, the process is marginally capable but unstable. These two scenarios require completely different improvement strategies, and only the baseline calculation tells you which one you are facing.
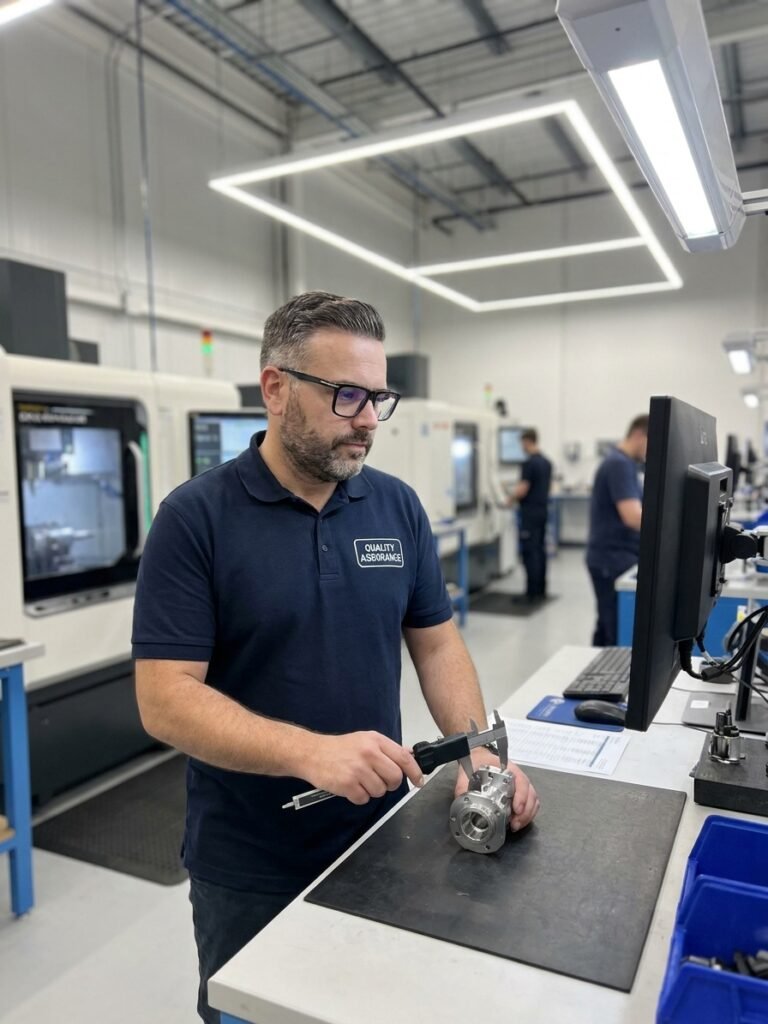
Analyse: Isolating Root Causes with Statistical Tools
The Analyse phase separates correlation from causation. Pareto charts identify which defect categories contribute the bulk of the loss, and fishbone diagrams map the potential causes across machine, method, material, measurement, environment, and manpower. But these are screening tools. The real work begins with hypothesis testing and Design of Experiments (DOE) to confirm which variables have a statistically significant effect on the output.
In an ArcelorMittal project, a 70% reduction in cost of poor quality came from applying this sequence to a surface-defect problem. Pareto analysis showed that three defect types accounted for 85% of the claims. DOE then identified two process parameters — rolling temperature and line speed — as the significant contributors. The team confirmed the interaction effect with a confirmation run, which is the step most teams skip. Without confirmation, you are implementing a change based on an assumption, not on proven statistical significance.
A common failure mode at this stage is stopping at the first plausible cause. A team sees that Machine B produces more defects than Machine A, concludes the machine is the problem, and moves to Improve. The rigorous approach tests whether the difference is statistically significant, then checks for confounding variables — different operators, different material lots, different shift patterns. The discipline of running a proper DOE prevents implementing a fix that addresses a symptom while the true root cause continues to generate defects.
Improve: Translating Analysis into Verified Process Change
The Improve phase implements the changes the Analyse phase validated. The sequence is deliberate: pilot the change on a limited run, measure the output, and verify the improvement with a capability study comparing the new Cpk against the baseline. If the pilot run shows Cpk moving from 0.8 to 1.33, the change is validated. If it shows no statistical improvement, the team returns to Analyse.
At Norgren, a 25% reduction in Work-In-Progress inventory came from applying DMAIC to the production flow. The Analyse phase used value-stream mapping combined with statistical analysis of cycle-time variation to locate the bottleneck. The Improve phase rebalanced the line and implemented pull-system controls at the constraint operation. The result was measurable in euros of freed working capital, not in subjective impressions of flow. That is the standard for a completed Improve phase: the gain must be quantified and the new state must be proven statistically different from the old one.
The DMAIC Sequence for Verified Improvement
- 01DefineQuantify the defect in customer terms and calculate the cost of poor quality.
- 02MeasureValidate the measurement system (MSA) and establish baseline Cpk.
- 03AnalyseUse DOE and hypothesis testing to isolate significant process variables.
- 04ImprovePilot the change and confirm statistical significance with a capability study.
- 05ControlLock in gains with SPC charts and updated control plans.
Control: Sustaining the Gain Through SPC and Control Plans
Control is where the methodology earns its return. An improvement that is not sustained is an experiment, not a result. The control mechanism in a manufacturing environment is Statistical Process Control (SPC) — control charts that track the critical process variables identified during Analyse, paired with a control plan that specifies reaction procedures when a point goes out of control.
The control plan must be integrated into the PPAP or first-article inspection documentation for IATF 16949 and AS9100 systems. If the improved process parameters are not reflected in the Control Plan, the PFMEA, and the operator work instructions, the next production run will revert to the old settings. I have audited plants where a Six Sigma project delivered a verified Cpk of 1.67, and the follow-up audit six months later showed Cpk back at 1.0 because the control plan was never updated and the SPC chart was never implemented on the floor.
An automotive supplier I worked with achieved a 70% reduction in customer complaints and a 50% improvement in first-time-through quality by running the full DMAIC cycle across their critical processes. The sustained result came from the Control phase: SPC charts on every identified critical-to-quality characteristic, control plans updated within the PPAP submission, and a layered process audit schedule that verified the controls were active. Without that infrastructure, the improvement would have lasted one production cycle.
Why Six Sigma Projects Fail in Practice
Most Six Sigma failures are execution failures, not methodology failures. The most common pattern is a team that rushes through Define and Measure to get to what they consider the real work, skipping the MSA and baseline calculation. They implement a change based on inspection data, see a temporary improvement, and declare success. When the defect rate climbs back three months later, there is no baseline to compare against and no validated measurement system to investigate the regression.
Where DMAIC Projects Break Down
What teams do
- Skip MSA and rely on existing inspection data
- Stop Analyse at the first plausible cause
- Implement changes plant-wide without a pilot run
- Declare success without a post-improvement Cpk study
What works
- Validate gauge R&R before collecting baseline data
- Confirm significance with DOE and a confirmation run
- Pilot the change and verify statistical improvement
- Update the control plan and implement SPC before closing
A second failure mode is treating Six Sigma as a parallel system rather than integrating it into the existing quality management framework. Projects that run outside the IATF 16949 or AS9100 documentation structure produce improvements that exist only in presentation slides. The corrected process parameters never reach the control plan, the PFMEA is never updated, and the operator instruction never changes. The improvement is real in the data, but it is invisible to the system that governs daily production.
A third pattern is the absence of a Control phase reaction plan. SPC charts are deployed, but when a point exceeds the control limit, there is no defined escalation procedure. The chart becomes decoration. A functional SPC system requires a documented reaction: who is notified, what action is taken, and what record is generated. Without that loop, the control chart is passive monitoring, not active control.
Integrating Six Sigma with APQP, PPAP, and Core Tools
Six Sigma does not replace the automotive or aerospace quality toolkit. It feeds into it. The output of a DMAIC project — identified critical-to-quality characteristics, validated process parameters, proven capability data — becomes the input for the Control Plan, the PFMEA risk reduction, and the PPAP submission. The methodologies are complementary, and the integration point is the documentation that governs the process.
Six Sigma does not replace your QMS. It gives you the statistical evidence to make your control plans accurate.
In my experience, the plants that sustain Six Sigma results are the ones that treat the methodology as an engine for updating their core tools. Every completed DMAIC project triggers a revision to the PFMEA, an update to the control plan, and a refresh of the operator work instruction. The MSA data from the Measure phase feeds into the gauge calibration system. The capability study from the Improve phase becomes part of the PPAP records for the next customer submission.
The standard for a successful Six Sigma program is measurable: reduced DPMO, improved Cpk on critical characteristics, lower cost of poor quality, and fewer customer escapes. The methodology delivers those results when the full DMAIC cycle is executed with statistical rigour and integrated into the quality management system. Anything less is a training exercise.
Statistical Thresholds for a Capable Process