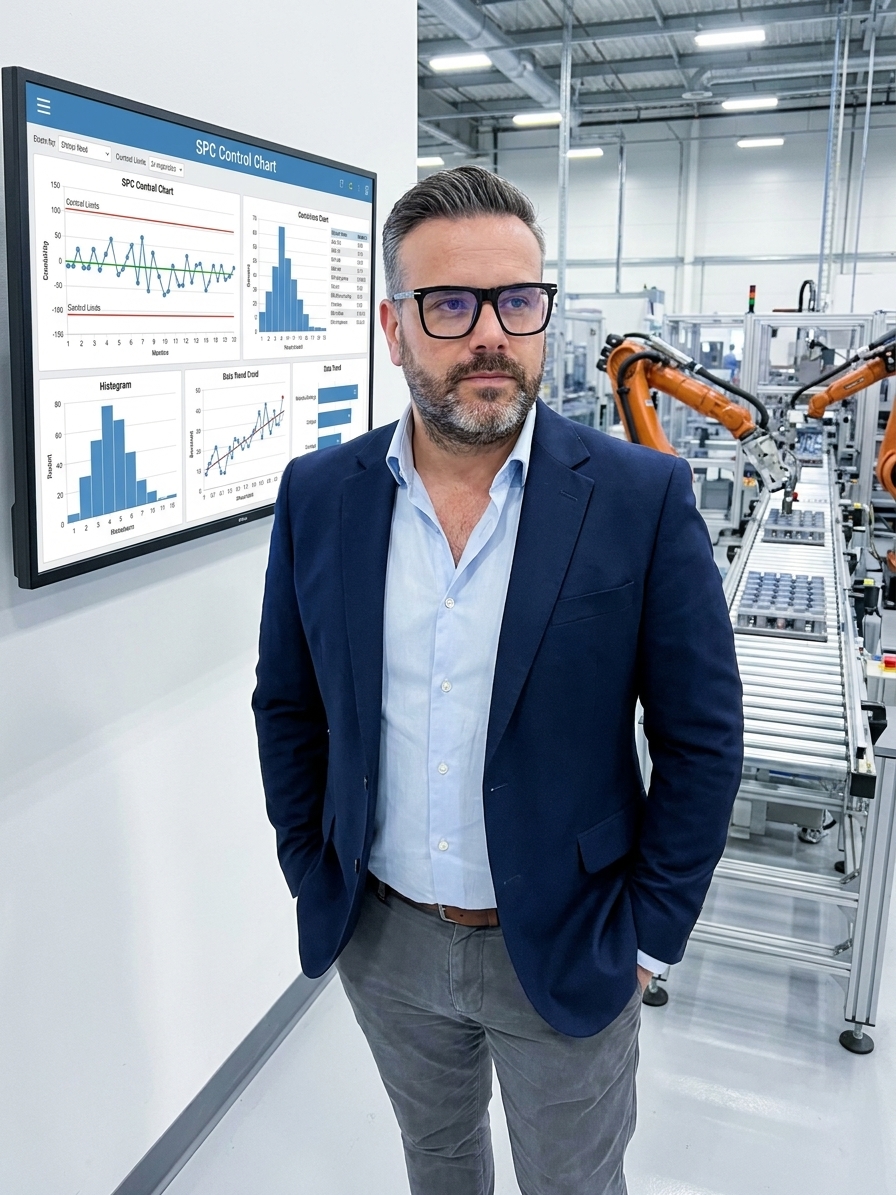
A Tier 1 automotive supplier once lost a critical customer account over a simple question posed during a corrective action investigation. The customer's quality engineer asked: "Do you use statistical process control on this characteristic?" The answer was no. The supplier was inspecting every hundredth part, but between inspection point three hundred and four hundred, the tooling wore past its threshold, and the bore drifted fourteen microns.
The shipment of 12,000 fuel injector housings was rejected because three units in a sample of fifty exceeded the upper specification limit. The supplier lost the account within eighteen months. Not because of the rejected shipment itself, but because the lack of SPC revealed a fundamental gap in their quality maturity to the customer.
Having implemented and transitioned ISO 9001 systems across automotive and aerospace plants, I have seen this exact scenario repeat across the industry. Organizations conflate inspecting parts with controlling processes. SPC is not statistics for the sake of compliance; it is a real-time communication system that tells you what your process is doing and where it is heading before it produces a defect.
Control Limits vs. Specification Limits
Every manufacturing process has natural variation. Common cause variation is the inherent, predictable noise of a stable process operating within its design limits. Special cause variation consists of the signals, shifts, and anomalies that indicate something has changed. Control charts separate these two by drawing boundaries based on the process's own historical behaviour.
Most organizations fail at SPC because they confuse control limits with specification limits. Specification limits describe what the customer wants. Control limits describe what the process is actually doing. A process can be in statistical control and still produce defective parts because it is centred in the wrong place. Conversely, a process can be out of control and still produce acceptable parts—until the trend continues.
When a data point falls outside the control limits, or when a pattern emerges—such as seven points trending in one direction, or eight points on one side of the centre line—the chart is signalling that something has changed. If you want to prevent defects instead of detecting them, you must react to these process signals, not just the final part measurements.
SPC vs. Inspection: What You Are Actually Measuring

Overcoming Organizational Resistance
Implementing SPC triggers predictable resistance. From production, the most common objection is: "We don't have time to measure parts and plot charts." This misses the point. SPC does not add measurement; it replaces random, ineffective measurement with targeted, intelligent measurement. The suppliers who say they lack time are usually already spending it on inspection that yields no actionable information.
From management, the pushback is usually: "We tried SPC before and it didn't work." When I hear this, the sequence is always the same. Someone bought software, trained a few people for two days, hung control charts on the wall, and walked away. Six months later, nobody was updating them. This is a management failure, not a tool failure. SPC is not a tool you deploy; it is a discipline you build and audit.
Even quality engineers object, claiming their process is too variable for SPC. This is like saying a patient is too sick for a diagnosis. If your process is highly variable, SPC tells you whether that variability is inherent (common cause, requiring process redesign) or induced (special cause, requiring investigation). Without SPC, you are guessing at the root cause.
Selecting the Right Control Charts
Not every characteristic demands SPC. Applying it indiscriminately wastes resources and creates chart fatigue, which guarantees the system will be abandoned. You must apply SPC to characteristics where the specification is tight relative to process capability, where the feature is critical to function or safety, or where the cost of a defect justifies the cost of monitoring.
For variable data sampled in subgroups, X-bar and R charts are the workhorses of the shop floor. They detect shifts in the process mean (X-bar) and changes in process dispersion (R). For low-volume or high-mix production where subgroups do not make sense, individuals and moving range (I-MR) charts track single measurements effectively.
For attribute data—pass/fail outcomes rather than measured dimensions—P charts track defectives, and U charts track defects per unit. In high-precision manufacturing where detecting small, persistent shifts is critical, CUSUM and EWMA charts identify problems hours or days earlier than standard Shewhart charts, though they require more statistical rigour to maintain.
The specific chart you choose matters less than the discipline of maintaining it, reviewing it, and acting on its signals. A simple individuals chart that an operator checks every morning is worth far more than a sophisticated CUSUM chart that nobody looks at.
| Chart Type | Application | Production Environment |
|---|---|---|
| X-bar and R | Variables data in subgroups | High-volume, stable machining lines |
| I-MR (Individuals) | Single unit measurements | Low-volume, high-mix, or destructive testing |
| P and U charts | Attribute data (pass/fail) | Visual inspection, assembly processes |
| CUSUM and EWMA | Small, persistent shifts | High-precision, tight-tolerance manufacturing |
Solving Complex Drift Through Capability Studies
Consider a medical device manufacturer struggling with the outer diameter of a catheter tube, specified at 2.45 mm ± 0.05 mm. Their defect rate was 1.8%—low enough to avoid crisis, high enough to drive €340,000 in annual scrap. They had final release testing, but no understanding of process behaviour between measurements.
A capability study of thirty consecutive samples from the extrusion line revealed the truth. The process was capable (Cpk of 1.41), but it was drifting slowly and consistently in a pattern that suggested tooling wear combined with unquantified temperature sensitivity. The defect rate was not caused by random failure; it was caused by predictable, unmanaged drift.
We implemented an X-bar and R chart on the extrusion line, sampling every thirty minutes. Within the first week, the chart detected a shift correlating with the morning warm-up cycle. The process was running larger during the first ninety minutes as the barrel temperature stabilized.
Because the special cause was visible, it was manageable. The team added a stabilization period before production measurement began and adjusted the starting temperature profile. The defect rate dropped from 1.8% to 0.3% within six weeks. The process was always communicating; someone was finally listening.
The Impact on Process Capability
SPC and process capability (Cpk) are inseparable. Control charts tell you whether the process is stable. Capability indices tell you whether that stable process is adequate to meet customer requirements. A process in statistical control with a Cpk below 1.0 will regularly produce defects, not because something broke, but because the natural variation is wider than the specification window.
SPC replaces opinions with observations, arguments with analysis, and firefighting with prevention.
A low Cpk is a common cause problem. It cannot be solved by investigating special causes or reacting to individual out-of-tolerance parts. It requires fundamental process improvement: better tooling, tighter material specifications, equipment upgrades, or design changes. Treating a common cause problem with special cause reactions only adds variation to the system.
Conversely, a process with a Cpk above 1.33 that suddenly shows an out-of-control signal is experiencing a special cause. This process was performing well, and something changed. This requires rapid investigation to identify and eliminate the specific shift, not a fundamental redesign of the process itself.
Building SPC Maturity on the Shop Floor
The highest level of SPC maturity is not having a control chart for every dimension. It is when the people running the process internalize the thinking. When operators understand variation, distinguish between common cause and special cause, and react to signals rather than noise.
I have audited plants where the operator on a CNC grinding line could recite the control limits on his three critical dimensions from memory, tell me the last time each chart signalled, and explain what the investigation found. He didn't update the charts because a quality manual demanded it. He updated them because the charts were how he understood his process.
When asked how he knows when to change the grinding wheel, he pointed at the chart. He doesn't wait for a defect, and he doesn't change it on a fixed preventive maintenance schedule. He reads the process through the data and makes a decision based on evidence.
Technology amplifies this discipline but cannot create it. Automated SPC software that connects directly to CMMs and inline gauges is a powerful tool, but only in an organization that investigates signals and acts on findings. The investment that matters is not the software license; it is the training and cultural shift that makes operators trust the data over their own intuition.